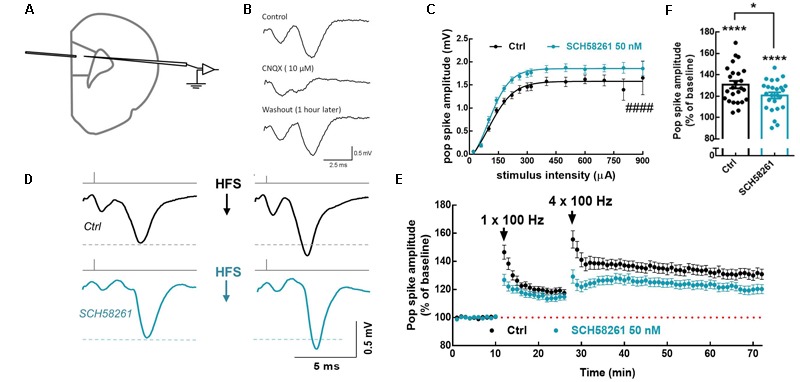
FIGURE 5.

A2AR facilitate LTP of population spikes in mPFC layer 5. (A) Positioning of the stimulating (layer 2/3 mPFC) and recording electrodes (layer 5 mPFC). (B) The recorded population spikes were abolished by the AMPA/kainate receptor antagonist, CNQX 10 μM. (C) Bath application of the selective A2AR antagonist, SCH58261 (50 nM; blue dots) increased the number and synchrony of cells discharging action potentials as indicated by the increase in the maximum response when the input/output response was assessed 20 min after SCH58261 superfusion. (D) Representative averaged traces at baseline and 30 min after the induction of LTP, in the absence and presence of SCH58261 (50 nM); SCH58261 decreased LTP magnitude. (E) Time course showing that SCH58261 decreased the magnitude of LTP of the population spike responses triggered by a priming train of high-frequency stimulation (HFS), followed 15 min later by four HFS trains (50 pulses at 100 Hz, 0.5 s duration, delivered every 10 s). (F) Summary plot displaying the variability of LTP magnitude, estimated 30 min after the induction of LTP, in the absence and presence of SCH58261 (50 nM). Data are mean ± SEM of 25 slices (from 25 rats) per group. ####p < 0.0001 comparing the estimated maximum response in the presence of SCH58261 to control (black bar/dots), unpaired Student’s t-test. ∗p < 0.05 comparing SCH58261 to control (black bar/dots), unpaired Student’s t-test. ∗∗∗∗p < 0.0001 compared to the hypothetical value of 100%, one-sample t-test.
