
Figure 1.
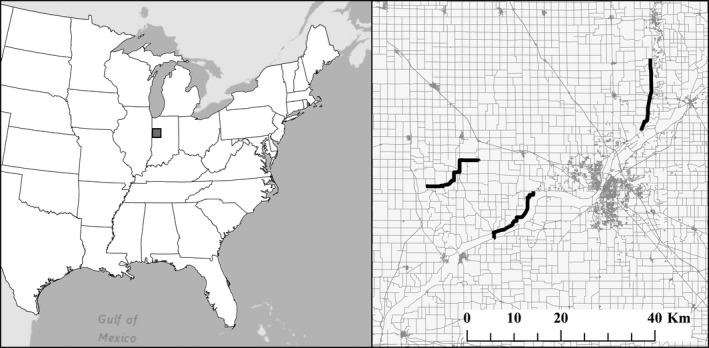
Location of the three routes sampled during 2013 in Indiana, USA, using variations on the standard mobile acoustic bat survey protocol. The left panel shows the eastern United States with the study area outlined by the gray box. The right panel displays the survey routes (black lines) and the roads (gray lines) within the study area