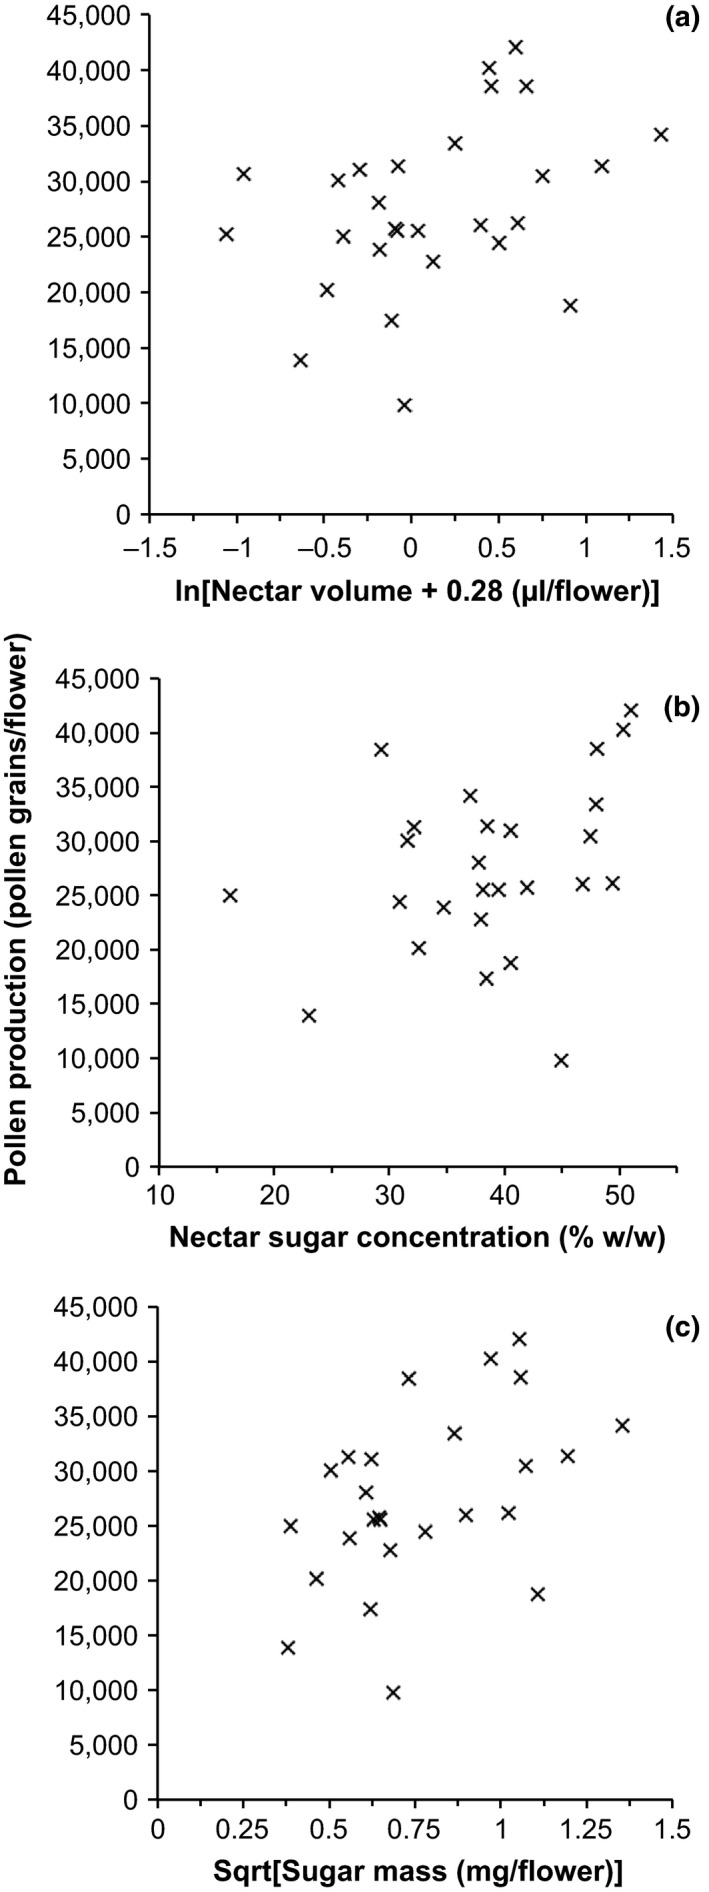
Figure 5.

The relationship between pollen production (grains/flower) and various measures of nectar production in V. faba lines. Each point represents an individual V. faba line mean (from Figures 2 and 3). (a) The relationship with nectar volume produced by a flower (μl). Nectar volume is ln transformed (n = 28, R 2 = .14, t = 2.04, p = .052). (b) The relationship with nectar sugar concentration (% w/w) (n = 26, R 2 = .11, t = 2.62, p = .096). (c) The relationship with the sugar mass (mg) produced by a flower. Sugar mass is square root transformed (n = 26, R 2 = .22, t = 2.61, p = .015)
