Figure 4.

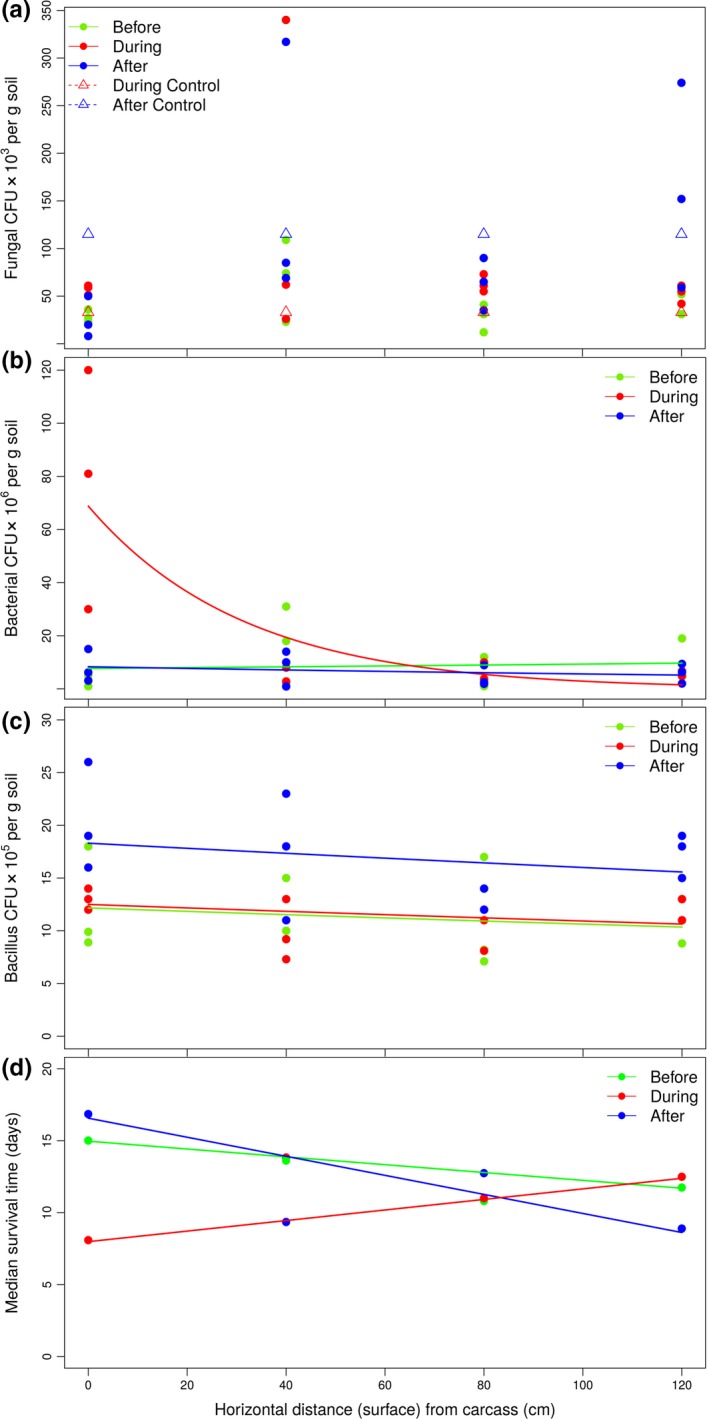
Potential risk of infection imposed on necrophagous insects represented by the effects of carcass decomposition (as measured by the evaluation periods, “Before,” “During,” and “After”) and horizontal (soil surface) distances from the carcass on the density of soil microorganisms (as numbers of colony‐forming units, CFU, per gram of soil): (a) fungal densities (CFUs ×103 per g soil). Neither distance (p = .531) nor carcass decomposition (p = .054) influenced Hypocreales densities in the superficial layer of soil. Controls correspond to samplings in an area without carcass; (b) densities of nonfastidious bacteria (CFUs ×106 per g soil). There were no significant differences in the bacterial densities between “Before” and “After” periods (p = .072). However, during the apex of decomposition, the higher densities of bacteria below the carcass are noteworthy (p < .001); (c) bacillus densities (CFUs ×105 per g soil). In this group, the densities were not influenced by distance from the carcass (p = .189). Also, there was no difference in the bacterial densities between “Before” and “During” periods (p = .823), with the highest bacillus density observed after total decomposition (p < .001). In (d), the effect of carcass decomposition and distance from carcass on median survival time of bait insects (Tenebrio molitor larvae) placed in permanent contact with soil sampled from around the carcass (according to horizontal transects, Figure 2a,b). There was no significant difference in the larval survivorship between “Before” and “After” periods (p = .115), with a median survival time of 14.8 days (vide Figure S2b, upper right side). During the apex of decomposition (“During” period), there was a decrease in larval survivorship, with a median survival time of 11.3 days. Larval mortality was assessed every two days. Curves represent the evaluation periods according to each graph legend; the total number of CFUs must be multiplied by the dilution factor expressed on the y‐axis in (a), (b), and (c). Detailed information of the statistical analyses is presented in the text
