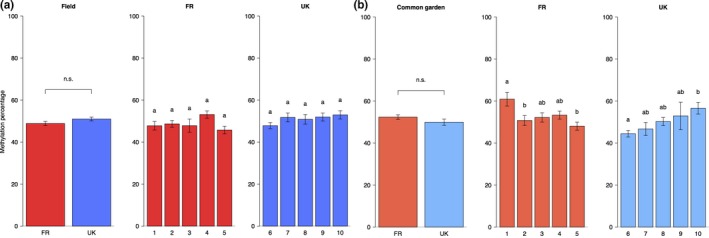
Figure 2.

Methylation percentage (±SE) of plants grown in the field (a) and plants grown in the common garden (b). First, the differences between FR and the UK are shown, followed by the differences between FR and UK populations. There were no significant differences between countries, significant differences between the populations per country were identified by post hoc comparisons and are indicated by lowercase letters
