Figure 1.
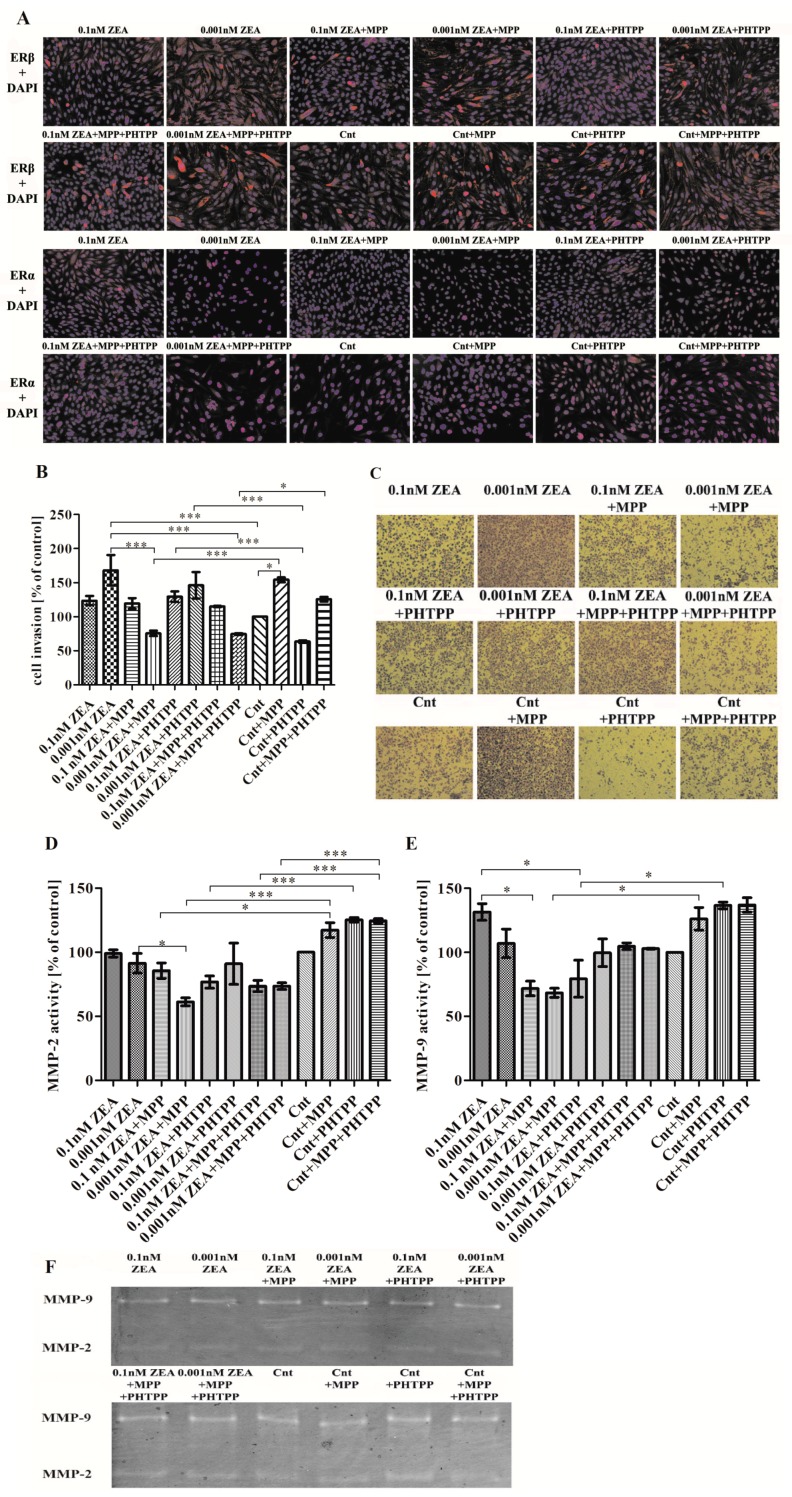
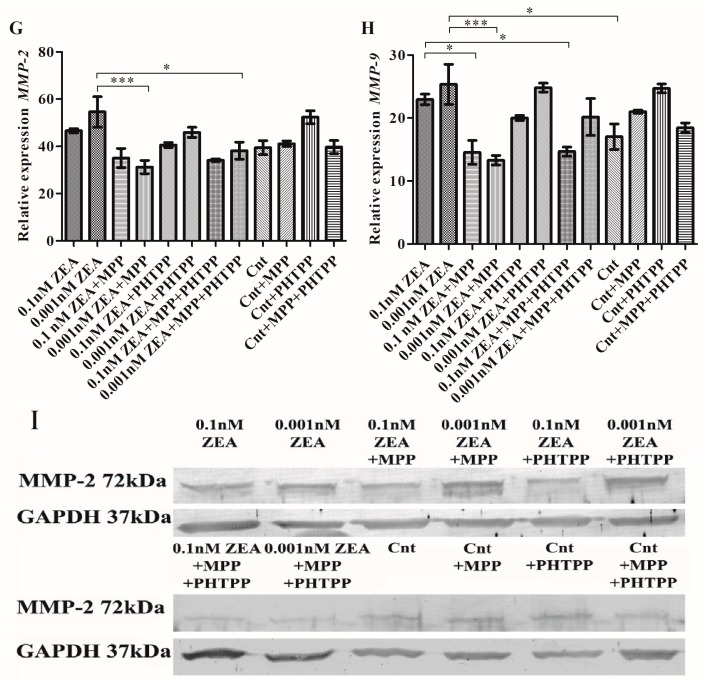
ZEA induces PC3 cell invasion dependent on ERα. (A) the results of ICC of ERα and ERβ (red stained) and DAPI (nuclei staining in blue); (B) the results from the cell invasion assay (modified Boyden chamber) are expressed as mean ± SE and presented as % of control; (C) representative results from cell invasion experiment, cells were stained with crystal violet and photographed in inverted microscopy; (D,E) the results from zymography assay are expressed as mean ± SE value as % of control cells; (F) representative results from zymography assay; (G,H) the results from the RT-qPCR study are expressed as mean ± SE and relative expression of genes was calculated as a ratio of ΔΔCt calculated expression of the gene od interest and reference genes: H3F3A, RPLP0 and RPS17; (I) the results from Western blot conducted to evaluate the expression of MMP-2, GAPDH was used as a reference. Statistically significant results were marked with lines, * p < 0.05, *** p < 0.001. ICC—immunocytochemistry, ER—estrogen receptor, DAPI—4’,6-diamidino-2-phenylindole, MMP-2—metalloproteinase 2, MMP-9—metalloproteinase 9, RPLP0—60S acidic ribosomal protein P0, RPS17—40S ribosomal protein S17, H3F3A—histone H3.3, MPP—ERα antagonist, PHTPP—ERβ antagonist, ZEA—zearalenone, Cnt—control cells.


