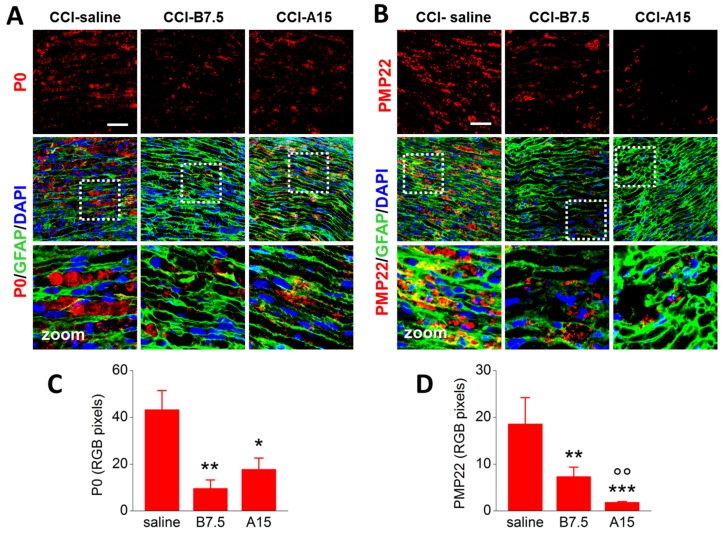
Figure 3.
IF analysis of P0 and PMP22 in injured sciatic nerve. (A,B) Representative examples of confocal images at high magnification (63×) showing single IF expression of P0 or PMP22 (red), or double IF with GFAP (green), and their quantification by RGB analysis (C,D), in sciatic nerve sections from CCI-saline, CCI-B7.5, and CCI-A15 mice. White dotted squares in panels with double IF indicate the zone of the section where zooming (×2) was taken. Zoomed images: typical examples of myelin ovoids, which are more expressed in CCI-saline mice. Scale bar: 50 μm. RGB analyses reveal lower expression of P0 and PMP22 in CCI-A15 and CCI-B7.5 with respect to CCI-saline mice. Statistical symbols: (*) p < 0.05, (**) p < 0.01 vs. CCI-saline; (oo) p < 0.01 vs. CCI-B7.5.

