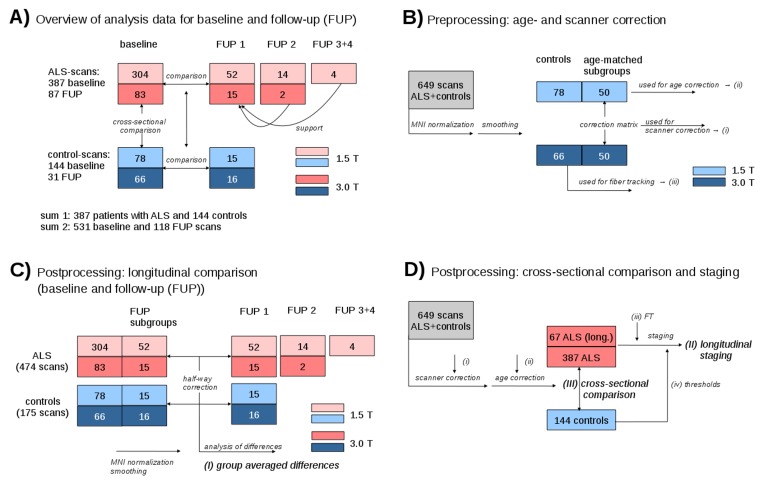
Figure 1.
Schematic overview of the data analysis workflow. (A) Schematic overview of subject distribution for 1.5 and 3.0 T for baseline and follow-up scans, respectively. (B) Control samples used for calculation of age correction (i), calculation of scanner correction matrices (ii) and for fibre tracking (iii). (C) Schematic representation of subject statistics for calculation of group averaged differences (i). (D) Scheme for longitudinal staging calculation (II) and for cross-sectional comparison (III).

