Figure 4.
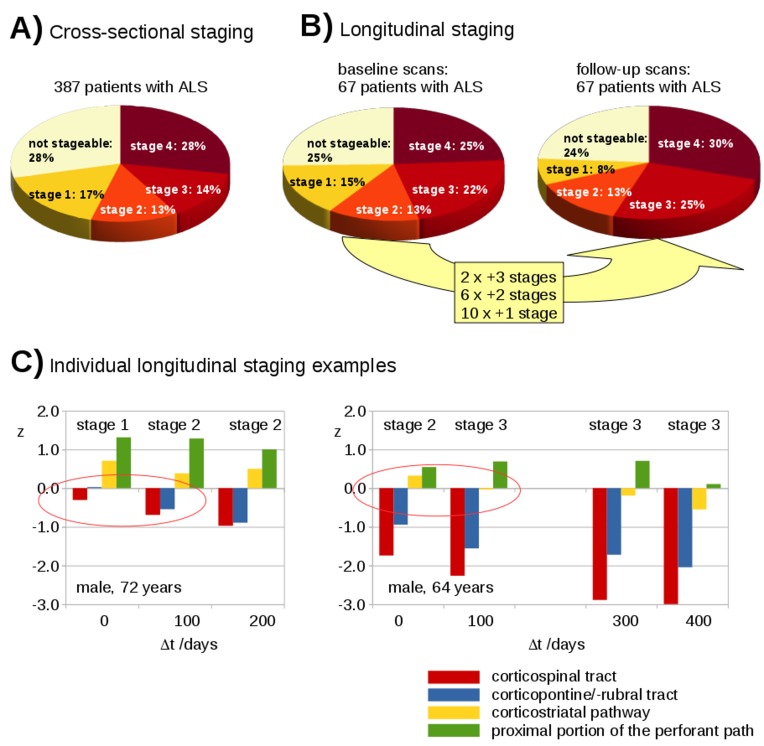
Cross-sectional and longitudinal staging. (A) Staging distribution for 387 patients with ALS at baseline. (B) Staging distribution for 67 patients with ALS at baseline and at follow-up. Eighteen patients with ALS increased in staging categorisation during follow-up time interval. (C) Two individual examples for the longitudinal categorisation profile of patients with ALS into ALS stages based on deviations of z-transformed FA values.

