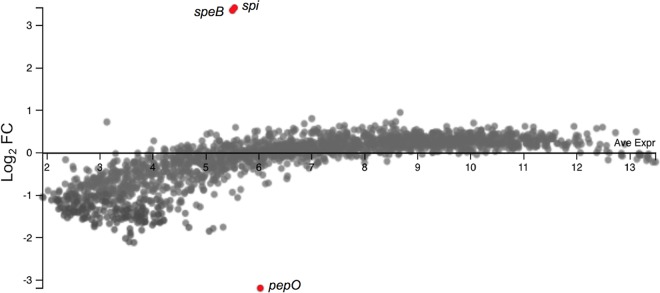
FIG 2.
Gene expression profiling of an M1T1 5448 pepO mutant strain. Microarray analysis (MA) plot comparison of gene expression in a pepO mutant relative to the wild-type strain based on microarray analyses. The fold change (FC) of each gene (represented as dot) is plotted against the average expression level. Genes with a >5-fold change in expression are highlighted in red. The plot was generated using the Degust Web server (http://degust.erc.monash.edu).

