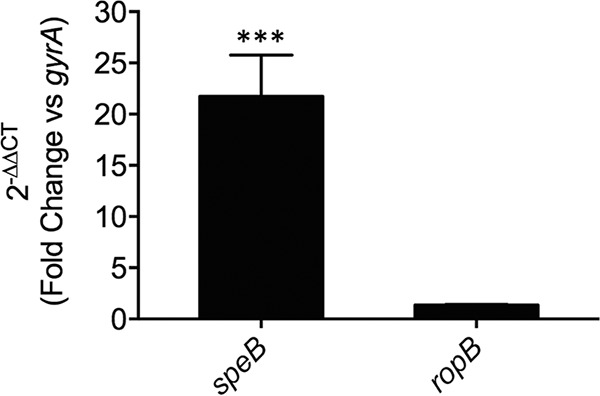
FIG 3.

Confirmation of microarray data by quantitative reverse transcriptase PCR analysis of gene expression. Gene expression of the two genes speB and ropB in 5448ΔpepO relative to the wild-type strain grown in THY broth to mid-log phase (A600, ∼0.8). Relative gene expression was calculated using the 2−ΔΔCT method using gyrA as the reference gene. A 2−ΔΔCT value equal to 1 (ratio of a ΔΔCT value of 0) indicates no change in gene expression compared to the wild-type control. Data represent the mean 2−ΔΔCT values ± standard deviations from 3 independent biological replicates. A two-tailed unpaired Student t test was used for comparisons to the wild-type control (***, P < 0.001).
