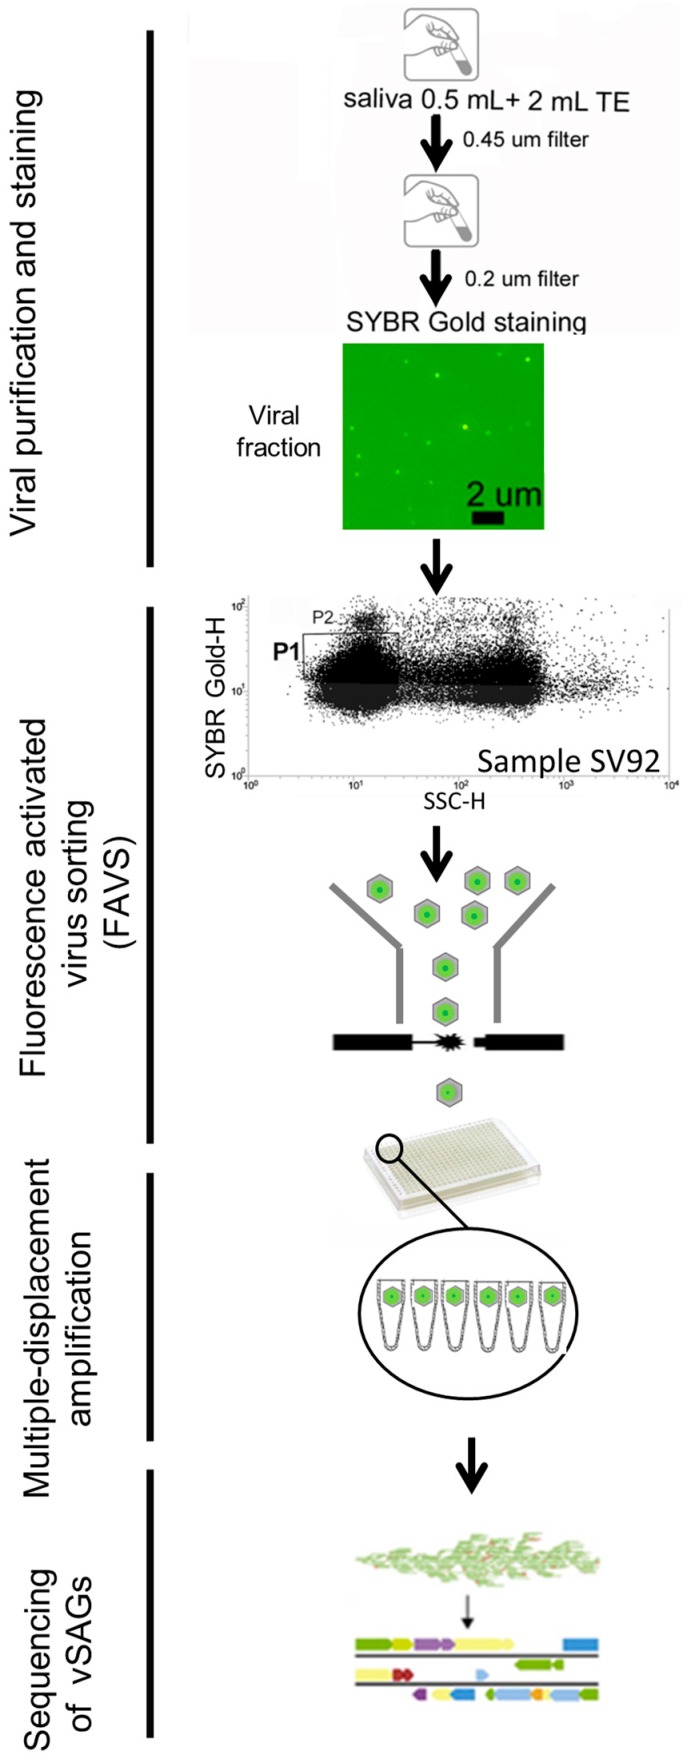
Figure 1.
Schematic workflow of single-virus genomics of saliva. Salivary samples were previously filtered to remove eukaryotic cells and bacteria. Viral particles were stained with SYBR Gold. Epifluorescence microscopy imaging of the viral fraction (sample SV92) confirmed the presence of viruses. Single viruses were sorted out by fluorescence-activated virus sorting (FAVS). Flow cytometry plot for the human salivary sample SV92 (see blank in Figure S1): for each sample, the flow cytometric plot of 90° light scatter (SSC-H; height value) and green fluorescence (SYBR Gold-H; height value, relative units) is shown. Gate P1 was used for sorting of single viruses. Viruses of gate P1 clearly outnumbered those in gate P2 (see Figure S1 for more details), and as this study was focused on viruses which are dominant and abundant in the oral cavity, single-virus genomics was performed only on sorted viruses from gate P1. Whole genome amplification of sorted single viruses was achieved by multiple displacement amplification. Positive viral single-amplified genomes (vSAGs) were sequenced by Illumina technology, and further assembled and analyzed.

