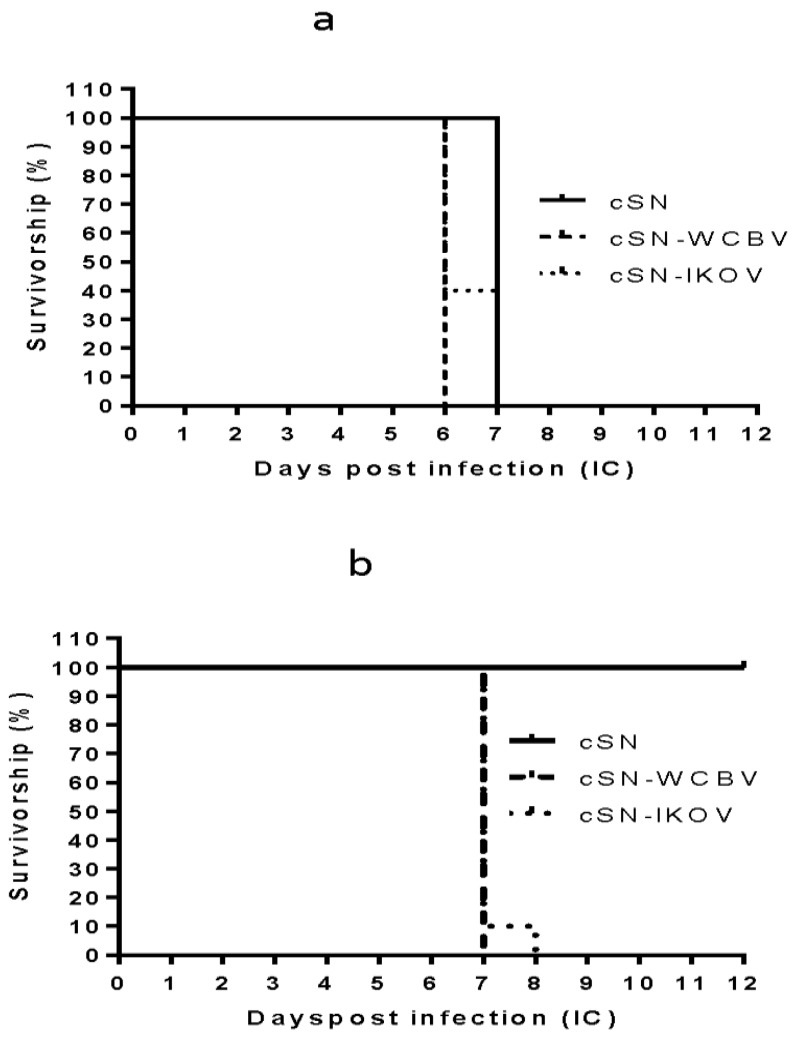
Figure 2.
Survival curve of mice challenged IC. (a) The survival curve of mock vaccinated mice (n = 5 per virus). (b) The survival curve of mice vaccinated with VeroRAB and challenged with cSN, cSN-WCBV-G, or cSN-IKOV-G (n = 10/virus). Each mouse was challenged with 100 ffu/30 μL of virus via the intracranial route. Mice were observed for 28 days but results only shown up to day 12 for clarity as after this point no further mice developed clinical disease.

