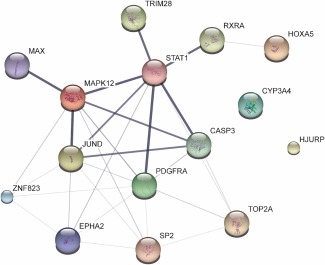
Figure 4.

Interactions among the top 15 gene/protein predictors. Interactions among the top 15 genes/proteins selected by our model to best predict cardiomyopathy using cardiomyocytes data are depicted as a network using the STITCH website for visualization. Small nodes correspond to protein of unknown 3D structure and large nodes to known or predicted. Edges represent protein‐protein associations and the intensity of the line is proportional to the confidence score of each association. The confidence score is calculated by combining the probabilities from all evidence channels and is corrected for random observation probability.
