
Figure 2.
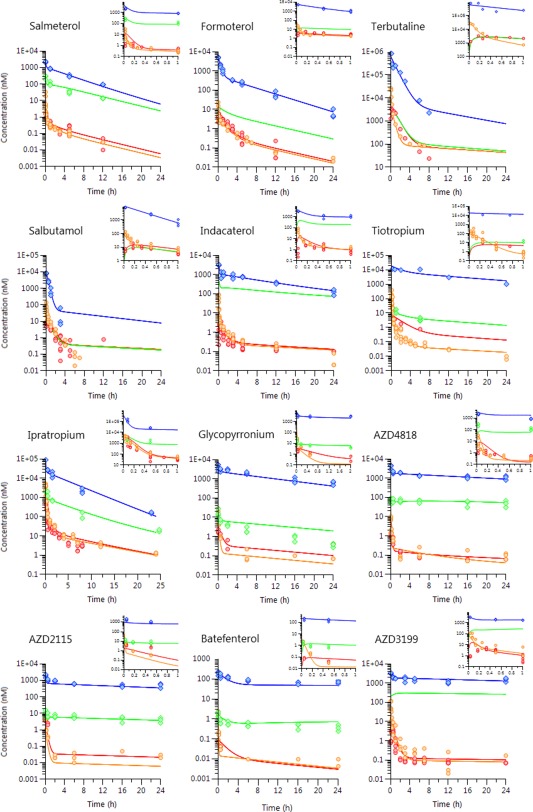
Observed individual plasma (circles) and lung concentrations (diamonds) with model‐fitted time profiles (solid lines) after i.t. and i.v. administration to rats. Plasma concentrations are colored red (after i.t.) or orange (after i.v.) and corresponding lung concentrations are either blue (after i.t.) or green (after i.v.).