
Figure 3.
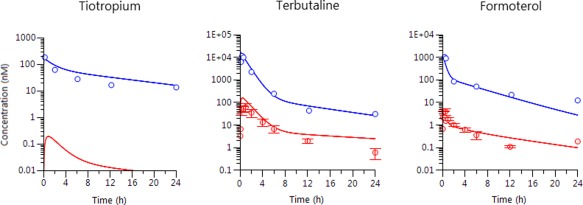
Observed averaged plasma (red) and individual lung (blue) concentrations (circles) with model‐simulated time profiles (solid lines) in dogs after i.t. dosing.
Official websites use .gov
A
.gov website belongs to an official
government organization in the United States.
Secure .gov websites use HTTPS
A lock (
) or https:// means you've safely
connected to the .gov website. Share sensitive
information only on official, secure websites.
Observed averaged plasma (red) and individual lung (blue) concentrations (circles) with model‐simulated time profiles (solid lines) in dogs after i.t. dosing.