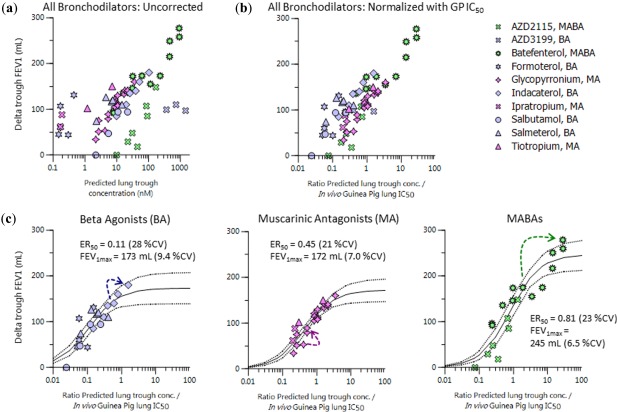
Figure 5.

(a) Predicted trough lung concentrations vs. trough placebo corrected change in forced expiratory volume in 1 second (FEV1) from baseline in patients with chronic obstructive pulmonary disease for various inhaled doses and regimes of bronchodilators. (b) Similar to a but with division of concentration term by in vivo guinea pig (GP) lung half‐maximal inhibitory concentration (IC50). (c) Maximum effect (Emax) model fitting results (solid lines) of pulmonary pharmacokinetic/pharmacodynamic relationships at trough for various bronchodilator drug classes, taken from b, and dashed lines indicate 95% confidence intervals. The arrows indicate the degree of accumulation in going from single to multiple dosing (beta agonist (BA): indacaterol 300 µg; muscarinic antagonist (MA): glycopyrronium 25 µg; and muscarinic antagonist/beta‐2 agonist (MABA): batefenterol 800 µg). CV, coefficient of variation.
