
Figure 5.
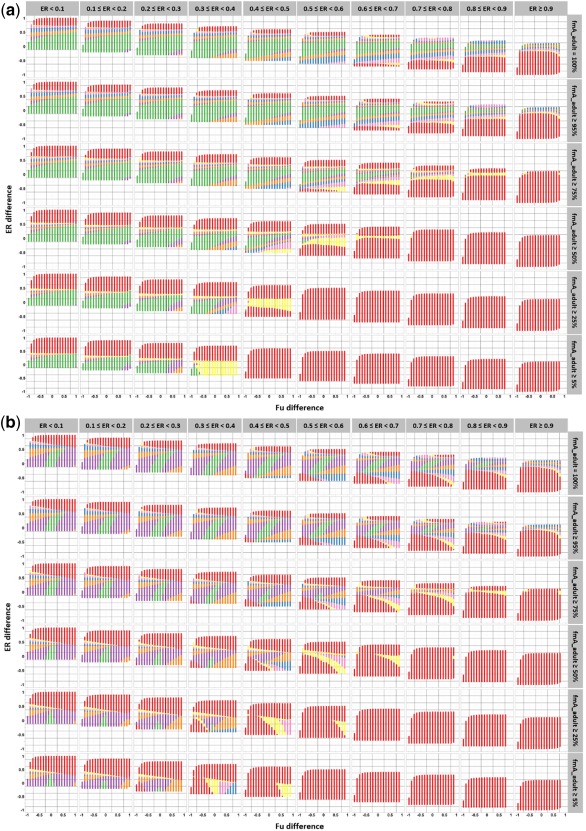
Illustration of model‐test drug scenarios that lead to accurate pathway‐specific drug plasma clearance (CLp) predictions for a test drug after between‐drug extrapolation of a pathway‐specific pediatric covariate function. Results are presented for drugs that are metabolized by CYP3A4 and that bind to human serum albumin (a) or alpha‐1 acid glycoprotein (b). Each column correspond to a range of extraction ratio (ER) values for the model drug in adults and each row to a specific range of fraction of drug (model and test drug) that is metabolized by CYP3A4 in adults. For each graph, the y‐axis represents the difference in extraction ratio between the test drug and the model drug (extraction ratio test drug – extraction ratio model drug) in adults, and the x‐axis represents the difference in unbound fraction in plasma between the test drugs and the model drug in adults (unbound fraction test drug – unbound fraction model drug). Each dot represents a model‐test drug scenario, including multiple model‐test drug combinations. A color code is used to indicate systematically accurate CLp predictions for all model‐test drug combinations within a model‐test drug scenario, for children ≥5 years (yellow), ≥2 years (pink), ≥1 year (blue), ≥6 months (orange), ≥1 month (purple), and ≥1 day term neonates (green). Red dots indicate model‐test drug scenarios leading to inaccurate predictions in children older than 5 years for at least one model‐test drug combination within the model‐test drug scenario. As an example, systematically accurate CLp scaling in children of 6 months and older is represented by the combination of the green, purple, and orange dots.