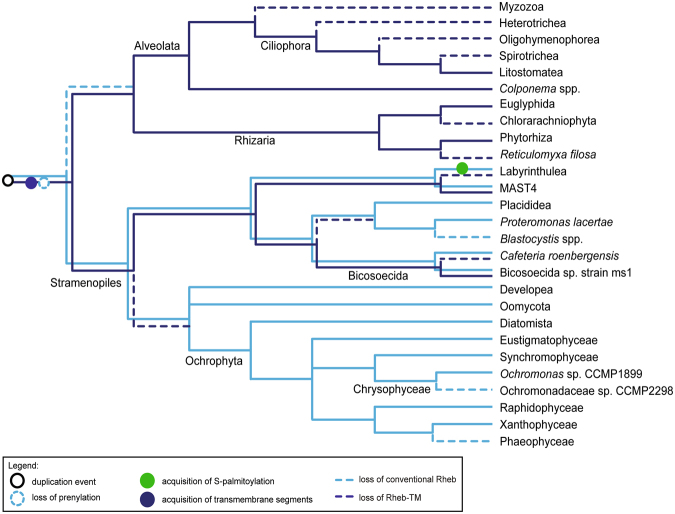
Figure 4.
A schematic of Rheb evolution in the SAR clade. The figure shows the most parsimonious interpretation of the taxonomic distribution, sequence features, and phylogenetic relationship of Rheb proteins in the group. The phylogenetic relationships of the taxa are depicted based on the most recent molecular phylogenetic and phylogenomic analyses. Relationships of the taxa are based on refs33,62,63. Species representing the broader clades indicated in the tree are listed in Supplementary Table S1.

