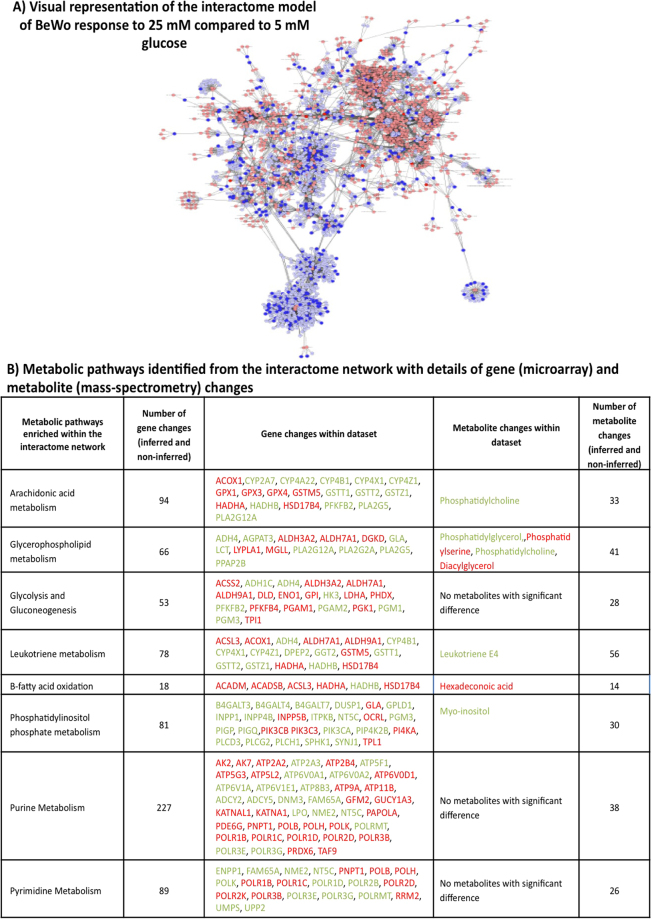
Figure 3.
Network analysis of integrated gene and metabolite changes in BeWo cells cultured in 25 mM glucose compared to 5 mM glucose. (A) 5632 genes and 41 metabolites that were differentially expressed (±1.3 FC) in BeWo cells following 48 h culture in 25 mM compared to 5 mM glucose were used to derive an interaction network inferred using MetScape (3.1.1) as visually represented here; dark blue circles represent gene changes seen in the BeWo dataset, light blue circles represent inferred gene interactions, dark red circles represent metabolite changes seen in the BeWo dataset, light red circles represent inferred metabolite interactions, grey lines represent protein-protein or protein-metabolite interactions. (B) Table of the metabolic pathways with the greatest number of gene and metabolite changes that were identified from the integrated gene and metabolite interactome network. Genes or metabolites shown in red were up-regulated, whereas those in green were down-regulated.

