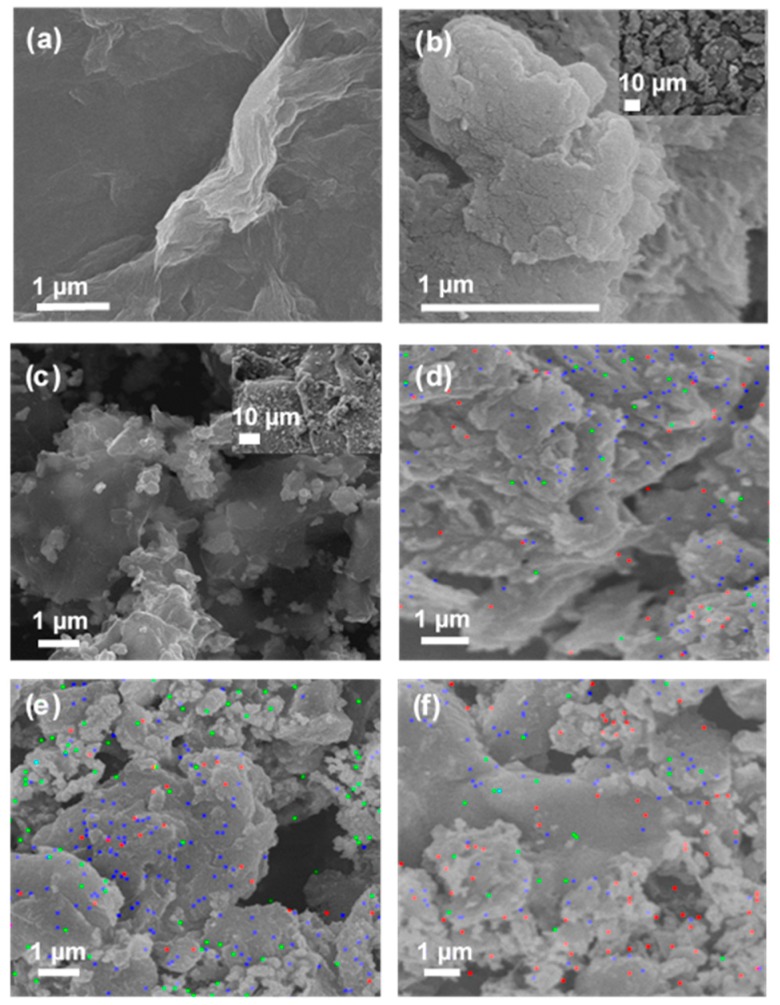
Figure 1.
The field emission scanning electron microscope (FESEM) images of (a) pristine graphene oxide (GO); (b) thiol grafted graphene oxide (GO–SH); and (c) GO-Ag 0.2 M composites; FESEM mapping of (d) GO-Ag 0.1 M; (e) GO-Ag 0.2 M; and (f) GO-Ag 0.25 M composites. The red, blue, and green colors represent the elemental distributions of Ag, C, and O.

