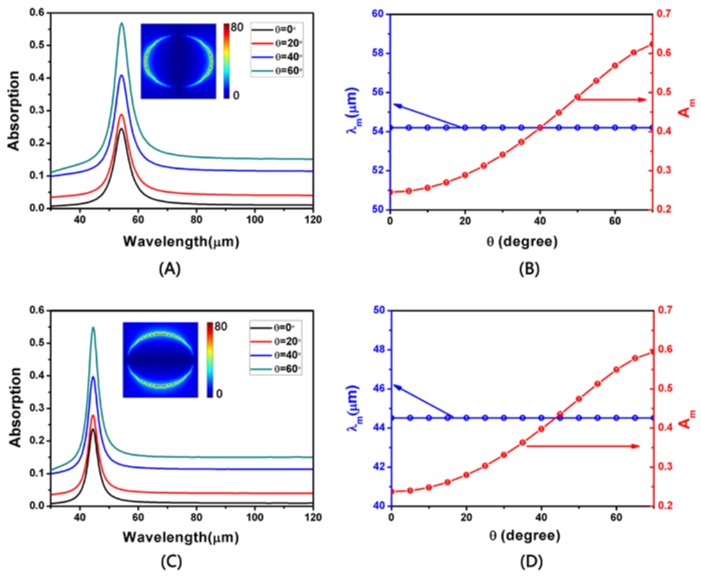
Figure 4.
(A,C) The simulated absorption at different incident angles on TM- and TE-polarization, respectively. The inserts indicate the distributions of electric field (|E|) at θ = 0°. (B,D) The resonance wavelength and absorption maximum at different incident angle on TM- and TE-polarization, respectively.

