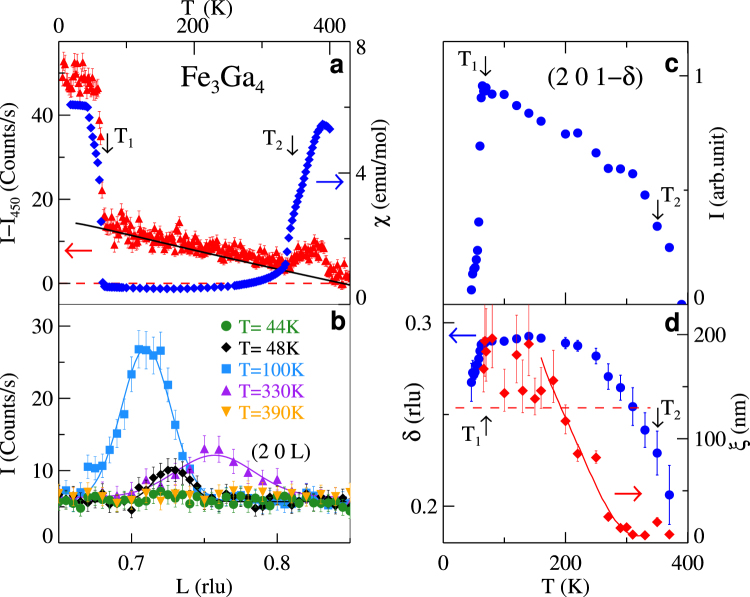
Figure 2.
Temperature dependent magnetic scattering and magnetic susceptibility. (a) Neutron scattering intensity at the (201) Bragg peak position, I − I450, (red triangles) and magnetic susceptibility, χ, at 100 Oe (blue diamonds) vs. T. I − I450 is the intensity, I, measured after subtraction of the intensity at 450 K, I450. Solid line is a fit of the Debye model43 to the data between 90 and 300 K with ΘD = 125 K20. (b) Scattering along the (2 0 L) direction at several representative temperatures demonstrating the incommensurate order. (c) Integrated intensity of the scattering at (2 0 1−δ) vs. T. (d) T dependence of δ (blue bullets) and the correlation length of the incommensurate scattering, ξ, (red diamonds) vs. T. Solid line is a guide to the eye. Dashed line is the instrumental resolution. Transition temperatures T1 and T2 are indicated in frames a, c, and d.

