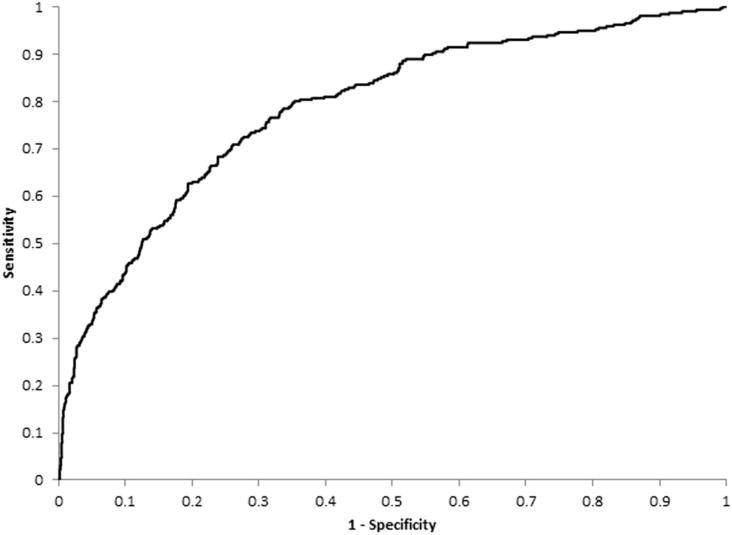
Figure 1.

ROC curve indicating the prognostic performance of the model in predicting probabilities of 5-year progression from unilateral to bilateral involvement by any age-related macular degeneration. A ROC curve that follows the left-hand and top axes of the graph (AUC=1) indicates that the model provides perfect discrimination, whereas a diagonal line from the bottom left-hand corner of the graph to the top right-hand corner (AUC=0.5) indicates a model with no discriminative value. Sensitivity (the true positive rate) indicates the proportion of participants with progression who were correctly identified by the model, whereas 1−specificity (the false positive rate) indicates the proportion of participants without progression who were misidentified by the model. AUC, area under the ROC curve; ROC, receiver operating characteristic.
