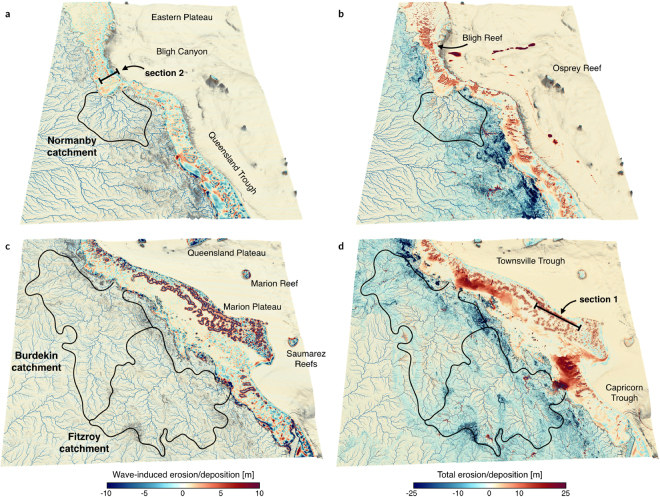
Figure 4.
Maps of cumulative erosion/deposition in metres at final time step for the northern (a and b panels) and southern (c and d) GBR regions visualised using Paraview (V 5.2.0). Left panels (a and c) display the cumulative effects of wave-induced erosion and deposition over the simulated period (14 ka). Right panels (b and d) show the erosion, deposition and reef evolution for the 14 ka induced by the combination of fluvial and waves processes as well as reef growth. Sections 1 and 2 are the locations of the stratigraphic cross-sections displayed in Fig. 5.

