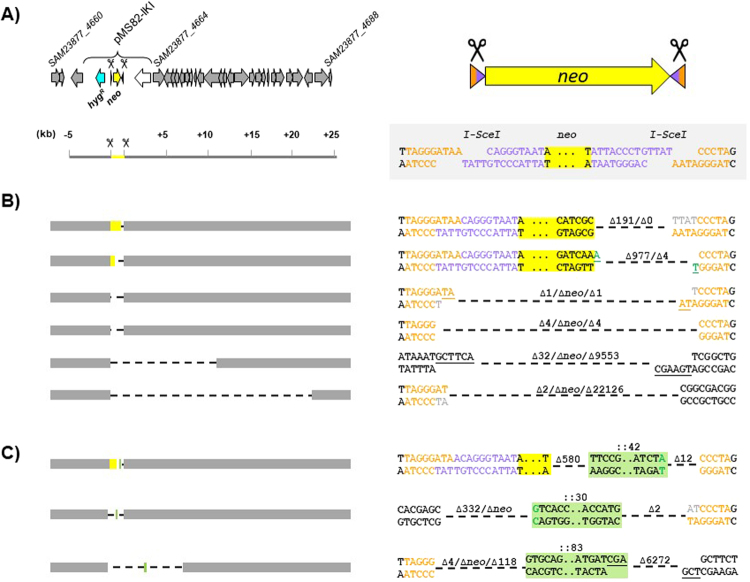
Figure 3.
DNA repair features after DSB generation at IKI-C. (A) IKI-C locus: the left panel shows the 30 kb region surrounding the insertion site of pMS82-IKI at IKI-C locus. Scale is in kilobases. Locus_tags of the CDS delimiting the region are indicated according to Thibessard et al.31. The right panel focuses on the IKI cassette structure and sequence. Since the I-SceI recognition site is a non palindromic sequence, the resulting restricted ends are distinguished by two different colors (orange and purple). The neo gene is colored in yellow while hygromycin resistance gene (hygR) is colored in cyan. All DNA repair event examples are represented at these two different scales (see B). (B) Examples of deletion events occurring at IKI-C at the kilobase (left panel) and nucleotide (right panel) scales. Grey boxes represent the region flanking IKI-C cassette. Deleted regions are symbolized by dotted lines. The ∆ symbol indicates the number of deleted nucleotides at each restricted end. When the ∆ symbol is followed by neo, it indicates a complete deletion of the kanamycin resistance gene. (C) DNA integration cases. Nucleotides added by fill-in synthesis are colored in grey. Nucleotides added by non-template addition are colored in green. DNA fragments integrated during repair are boxed in green. Microhomologies present at the repair scar are underlined.

