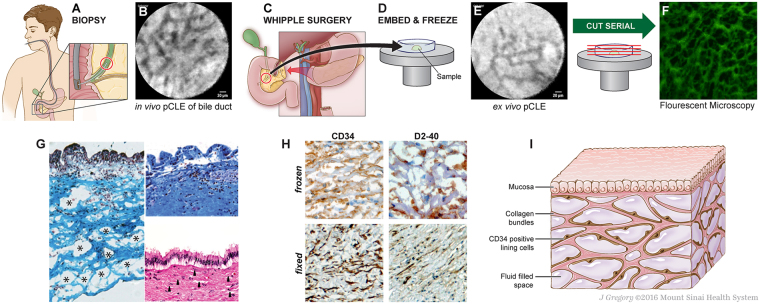
Figure 1.
Identification of bile duct reticular pattern and demonstration of submucosal space. (A,B) pCLE of bile duct after fluorescein injection shows a reticular pattern at a depth of 60–70 μm. Scale bar, 20 μm. (C–E) Bile duct tissue removed at the time of Whipple surgery was frozen and ex vivo pCLE performed, demonstrating persistence of the reticular pattern. Scale bar, 20 μm. (F) Unstained frozen tissue of submucosa of a bile duct imaged by fluorescent microscopy, showing the reticular pattern in this layer of bile duct wall. The “bright” spaces are now dark (fluoresceinated fluid drained in processing and the tissue structures remained stained with residual fluorescein). (G) Masson trichrome of fresh-frozen bile duct shows that the dark bands are collagen bundles (blue) (left). The upper right shows Masson trichrome of a normally processed/fixed bile duct from the same patient, with collapse of spaces and apparent adherence of collagen bundles to each other. Lower right shows the fixed specimen stained with H&E; the thin spaces between collagen layers (arrows) reflect normally fluid-filled spaces that are almost completely collapsed. (H) Frozen (top) and fixed (bottom) bile ducts immunostained with antibodies against CD34 (left, brown) and D2-40 (right, brown) show cells lining the collagen bundles; note that bundles often seem to have a lining cell on one side, but not the other (20×, DAB, hematoxylin). (I) Schematic of the fluid-filled space supported by a network of collagen bundles lined on one side with cells. Illustration by Jill Gregory. Printed with permission from Mount Sinai Health System, licenced under CC-BY-ND. (https://creativecommons.org/licenses/by-nd/4.0/legalcode).

