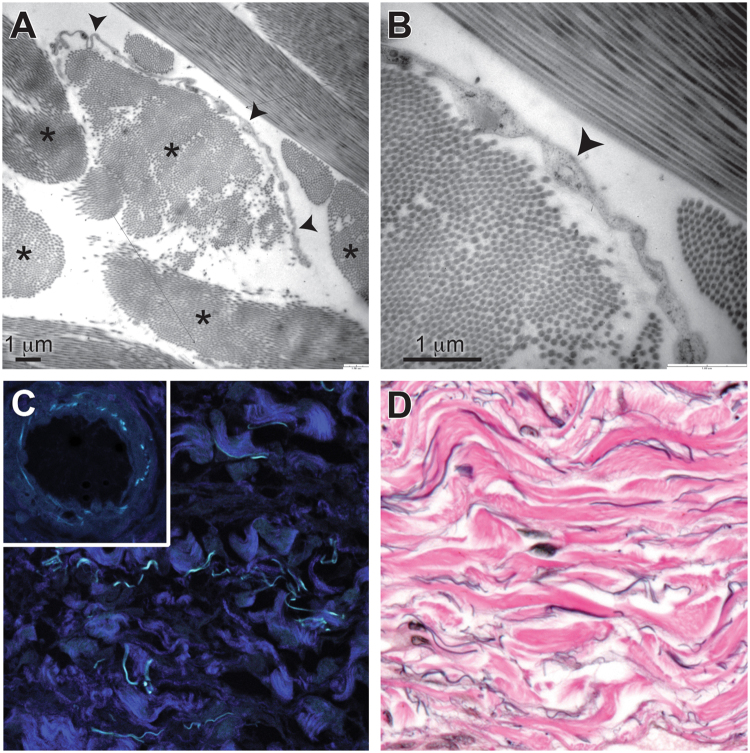
Figure 2.
Structural evaluation of the interstitial space. (A) Transmission electron microscopy shows collagen bundles (asterisks) that are composed of well-organized collagen fibrils. Some collagen bundles have a single flat cell along one side (arrowheads). Scale bar, 1 μm. (B) Higher magnification shows that cells (arrowhead) lack features of endothelium or other types of cells and have no basement membrane. Scale bar, 1 μm. (C) Second harmonics generation imaging shows that the bundles are fibrillar collagen (dark blue). Cyan-colored fibers are from autofluorescence and are likely elastin, as shown by similar autofluorescence in the elastic lamina of a nearby artery (inset) (40×). (D) Elastic van Gieson stain shows elastin fibers (black) running along collagen bundles (pink) (40×).

