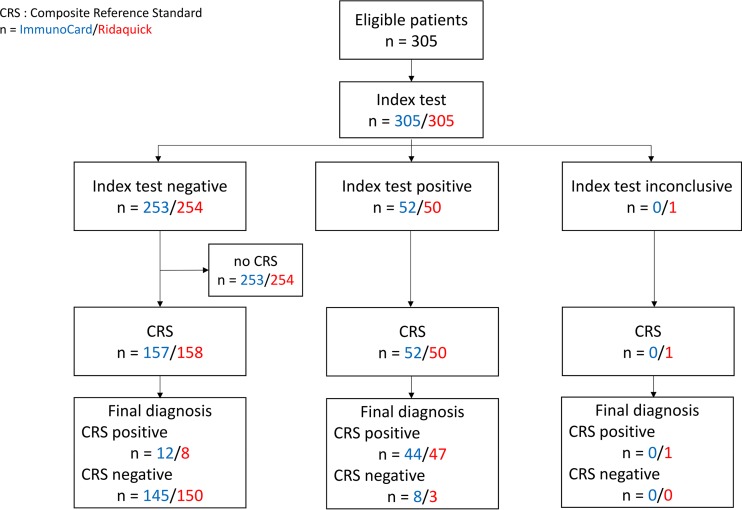
FIG 1.
Flow chart of the study. The flow chart indicates the numbers of participants at each stage of the Campylobacter test study, i.e., the numbers of patients receiving each ICT index test (blue, ImmunoCard STAT! Campy; red, Ridaquick Campylobacter), the numbers receiving the CRS among them, and also the numbers of patients with a positive or a negative result according to the CRS.

