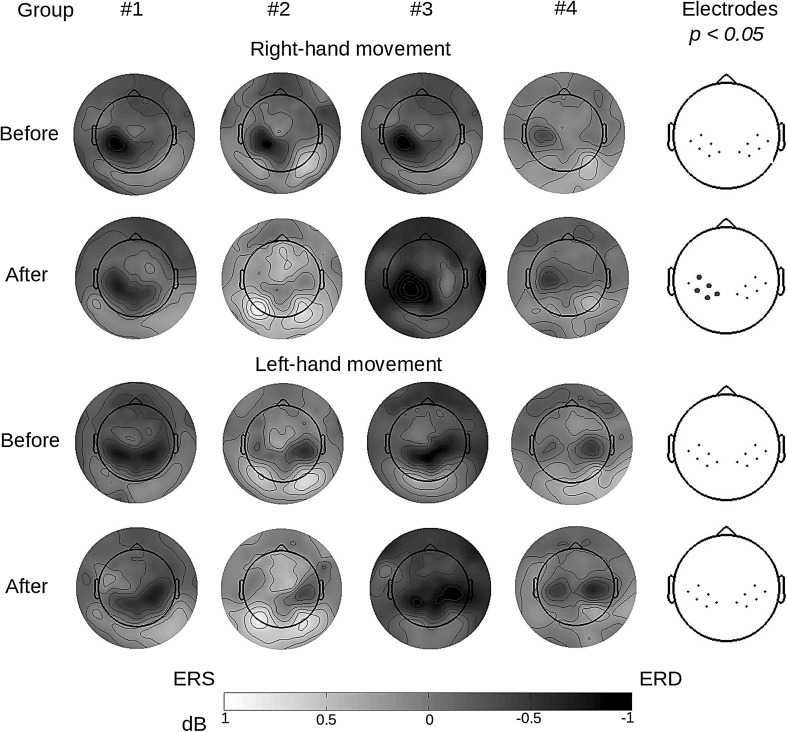
Fig. 4.
Maps of SMR distribution on the skull (8–30 Hz) during imagined movement of the right and left hand. Electrodes shown on the right registered statistically significant differences in the strength of signal between the experimental groups (marked with grey dots). There is a visible lack of differences before the training procedure was applied

