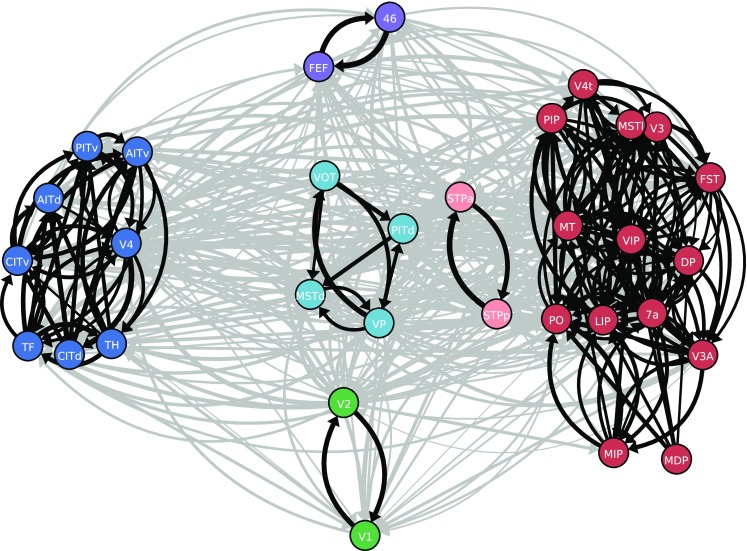
Fig. 7.

Community structure of the network. Clusters in the connectivity graph, indicated by the color of the nodes: lower visual areas (green), dorsal stream areas (red), superior temporal polysensory areas (light red), mixed cluster containing areas VP, VOT, PITd and MSTd (light blue), ventral stream (dark blue), and frontal areas (purple). Black, connections within clusters; gray, connections between clusters. Line thickness encodes logarithmized outdegrees. Only edges with relative outdegree are shown. For visual clarity, clusters are spatially segregated and inside clusters, areas are positioned using a force-directed algorithm (Kamada and Kawai 1989)
