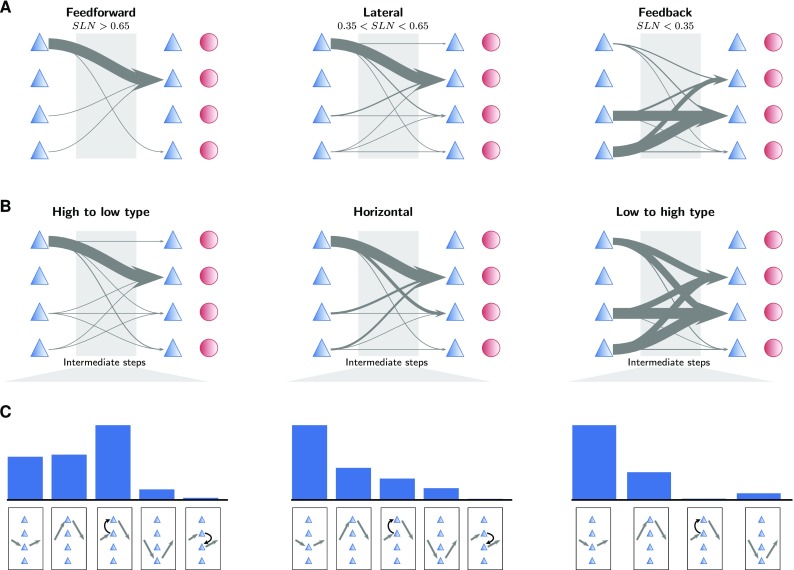
Fig. 8.

Population specificity organizes paths hierarchically and structurally. a Population-specific patterns of shortest paths between directly connected pairs of areas categorized according to their hierarchical relation as defined by fractions of supragranular labeled neurons (SLN). Arrow thickness indicates the relative occurrence of the particular pattern. The symbols mark excitatory (blue triangles) and inhibitory (red circles) populations stacked from L2/3 (top) to L6 (bottom). b Population-specific patterns of shortest paths between all pairs of areas categorized according to the difference between their architectural types. Arrow thickness indicates the occurrence of the particular pattern. c Occurrence of population patterns in areas that appear in the intermediate stage in the shortest path between two areas
