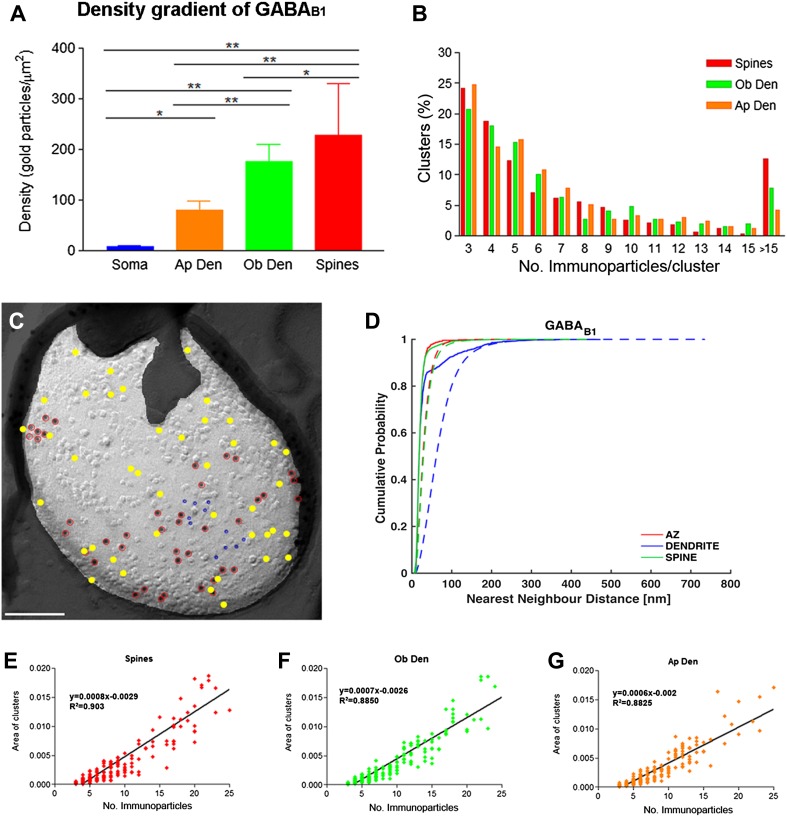
Fig. 3.
Density gradient and distribution profile of immunoparticles labelling GABAB1 along the surface of PCs. a Density of GABAB1 immunoparticles (including both isolated particles and those within small aggregations) increased from soma to distal dendrites (soma = 8.71 ± 1.43/μm2; apical dendrite = 79.14 ± 18.98/μm2; oblique dendrite = 175.33 ± 34.63/μm2; spines = 227.62 ± 102.18/μm2; Kruskal–Wallis test, pairwise Mann–Whitney U test and Dunn’s method, *p = 0.003; **p < 0.001). b The graph shows the quantification for the size of GABAB1 clusters in the spines, oblique dendrites and apical dendrites. Approximately 75% of clusters consisted of 3–8 immunoparticles. c Example showing random simulation of GABAB1 immunoparticles in a dendritic spine. Red: real GABAB1; Yellow: simulated GABAB1; blue: real GIRK2. Scale bar: 100 nm. d Cumulative probability plots of GABAB1 to GABAB1 NND. Solid and dotted lines show real and simulated GABAB1, respectively. AZ active zone. e–g Positive linear correlation was found between the number of GABAB1 immunoparticles and the area of clusters in the three dendritic compartments [spines, oblique dendrites (Ob Den) and apical dendrites (Ap Den)]

