Fig. 2.
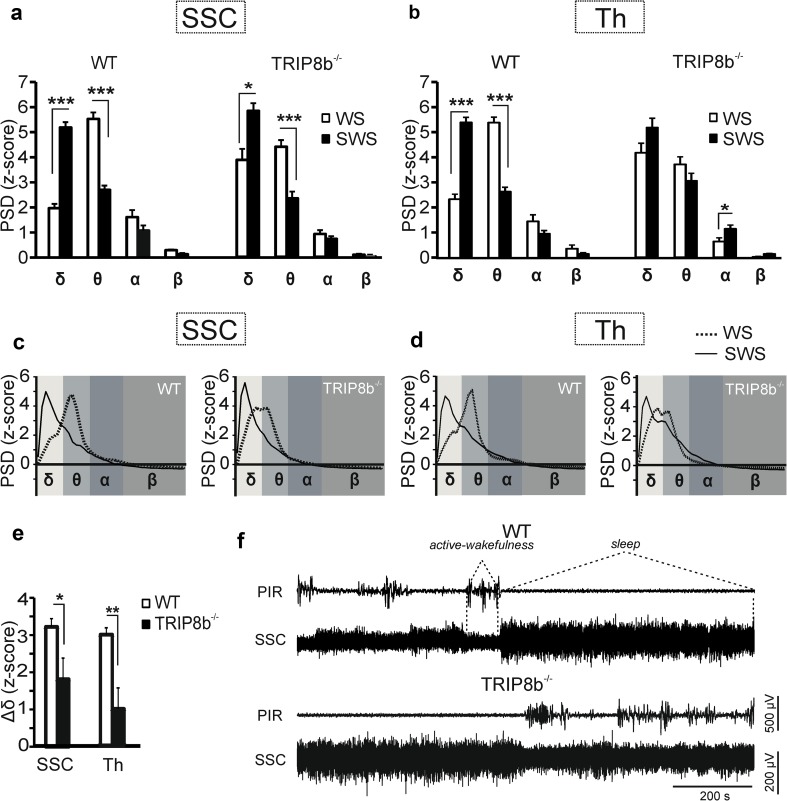
Modulation of cortical and thalamic slow-frequency oscillations by TRIP8b during episodes of slow-wave sleep and active-wakefulness. a and b Bar graphs comparing the normalized peak frequency PSD (z-score) of four frequency bands (δ–β) in somatosensory cortex (SSC) and VPM (Th) of WT and TRIP8b−/− mice between episodes of active-wakefulness (WS) and slow-wave sleep (SWS). (mixed repeated measures ANOVAs followed by Student’s t tests, n = 7/7, *, **, *** indicate p < 0.05, p < 0.01, p < 0.001, respectively). c and d Representative spectrograms indicating the difference between the PSD during WS and SWS. e Bar graph comparing the changes in delta frequency oscillations (Δδ) between the deep non-REM sleep (SWS) and active-wakefulness in WT and TRIP8b−/− mice. As illustrated, TRIP8b−/− mice (n = 7) show less (Student’s t tests, p < 0.05 for SSC and p < 0.01 for thalamus) changes in Δδ compared to WT (n = 7) mice. f Sample LFP recordings from the SSC of WT (upper panel) and TRIP8b−/− (lower panel) mice, showing the EEG signal during non-REM sleep and active-wakefulness in combination with the signal recorded from infrared movement detector (PIR). Note the smaller difference in the amplitude of the LFP between deep non-REM sleep and active-wakefulness in TRIP8b−/− compared to WT mice. Dashed lines indicate episodes of sleep and active-wakefulness detected with the aid of both PIR and LFP signal

