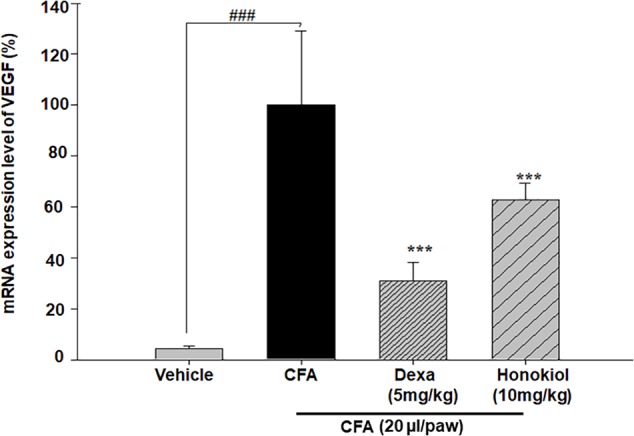
FIGURE 12.

Effect of honokiol on inhibition of VEGF in CFA induced honokiol (10 mg/kg) treated paw tissue where (n = 5). Error bar shows the standard deviation, i.e., significant difference from control values. ∗P < 0.05, ∗∗P < 0.01 and ∗∗∗P < 0.001; ###P < 0.001 indicates a significant difference from the untreated control group.
