
Figure 2.
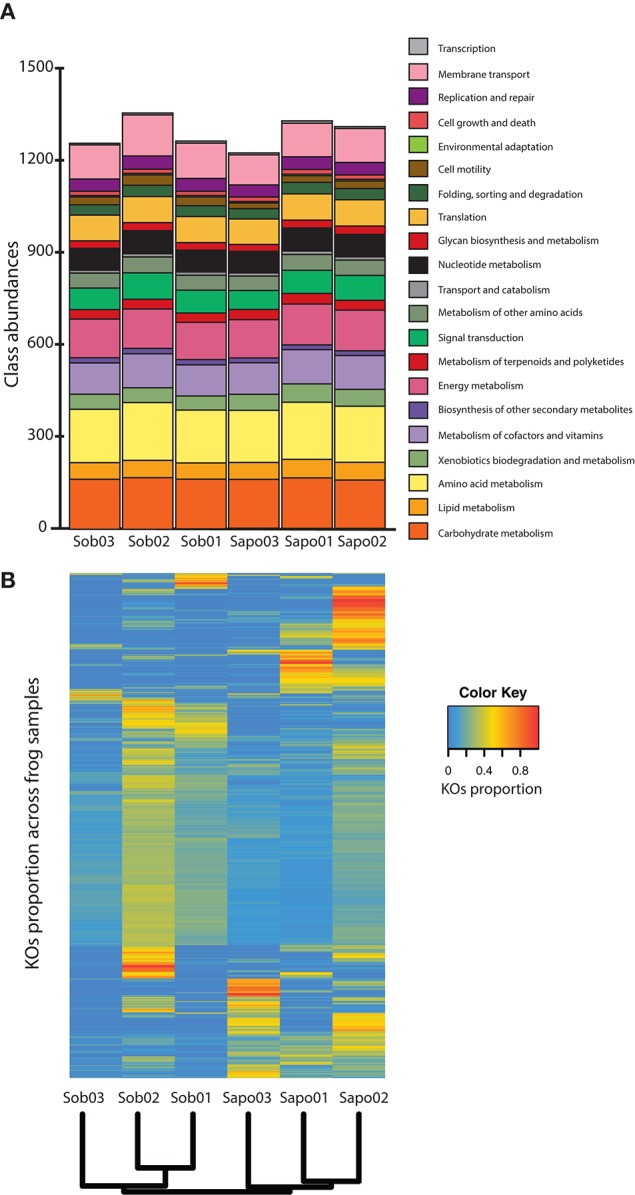
Read level analysis (A) Class abundances normalized with MUSiCC. (B) Heatmap showing the relative abundance of KOs across samples. Rows are individual KOs and columns are frog samples. Dendogram at the bottom indicates clustering of samples based on Bray-Curtis distances. Colors indicate the relative abundance (proportions) of KOs across samples (see color legend on the right hand side of the figure).