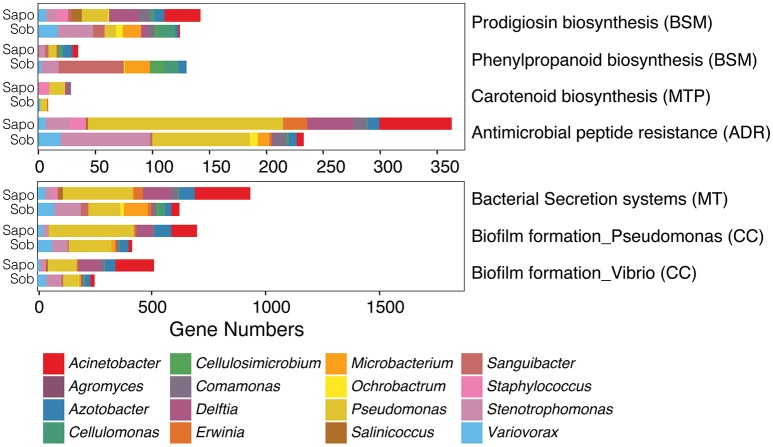
Figure 4.
Contig level analysis. Gene abundance plots of significant pathways enriched in Sob or Sapo sites within five functional classes from KEGG involved in bacterial communication and bacterial-host-pathogen interactions. Each bar represents the gene abundances for Sapo (N = 3) and Sob (N = 3) sites. Colors indicate the taxonomic assignment.

