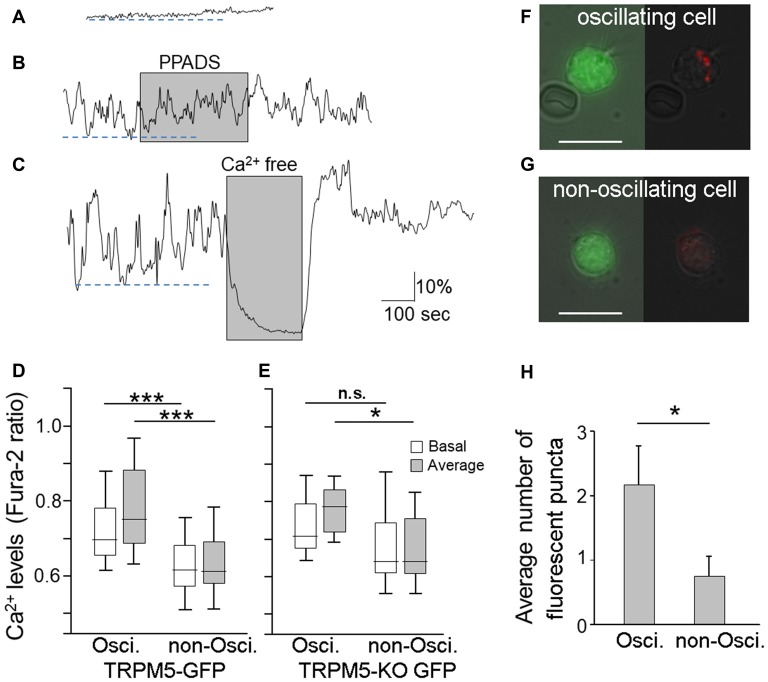
Figure 3.
Endocytotic dye internalization in TRPM5-MCs with spontaneous Ca2+ oscillation. (A–C) Traces of changes in Ca2+ levels recorded from two TRPM5-MCs. One MC showed a flat baseline Ca2+ level throughout the entire recording time (A); the other exhibited spontaneous Ca2+ oscillation (B,C). The purinergic P2 receptor blocker PPADS (5 μM) did not suppress the spontaneous oscillation (B, shaded). Elimination of extracellular Ca2+ using Ca2+-free saline diminished the oscillation (C, shaded). Dashed lines indicate basal Ca2+ levels determined by averaging lower peak points of oscillation during the first 300 s in oscillating cells (B,C) and in non-oscillating cell (A). (D) Basal Ca2+ levels and average Ca2+ levels from oscillating and non-oscillating cells of TRM5-GFP mice (***p < 0.001, t-test, n = 34 for oscillation cell and 75 for non-oscillating cells, respectively). (E) Basal Ca2+ levels and average Ca2+ levels from oscillating and non-oscillating TRPM5knockout (KO)-MCs isolated from TRPM5-KO GFP mice (*p < 0.05, n.s.: not significant, t-test, n = 8 and 8 cells for oscillation cell and for non-oscillating cells, respectively). (F,G) Paired images from an oscillating TRPM5-MC (F) show GFP (green, left panel) and internalized endocytotic dye pHrodo (red) overlaid with weak light image (right panel). A non-oscillating cell (G) shows no internal dye signal. Scale bars: 10 μm. (H) Average number of dyed puncta inside oscillating and non-oscillating TRPM5-MCs. Oscillating cells have significantly more dyed puncta than do non-oscillating cells (*p < 0.05, t-test, n = 6 for oscillation cell and 8 for non-oscillating cells, respectively).

