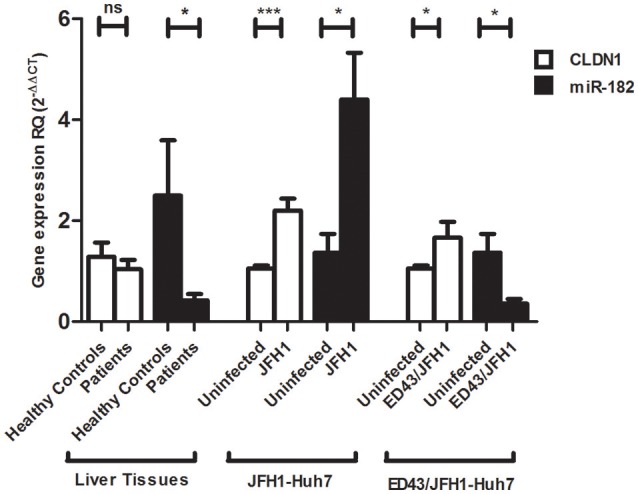
Figure 2.

Expression profile of CLDN1 and miR-182 in infected liver biopsies and Huh7 cells. No difference in CLDN1 mRNA expression is observed in liver biopsies of HCV patients (N = 17) compared to healthy controls (N = 10), while miR-182 (N = 17, p = 0.0211*) is downregulated in HCV-infected patients compared to healthy controls (N = 10). Higher expression of CLDN1 mRNA is observed in JFH1- (p < 0.0001***) and ED43/JFH1- (p = 0.0429*) infected compared to uninfected Huh7 cell lines. miR-182 shows higher expression levels in JFH1-infected Huh7 cells (p = 0.0156*) and reduced expression in ED43/JFH1-infected Huh7 cells (p = 0.0104*) compared to naïve Huh7 cells. Relative Quantitation (RQ) is used for expression of the results. ***p < 0.001, *p < 0.05 and ns, statistically not significant.
