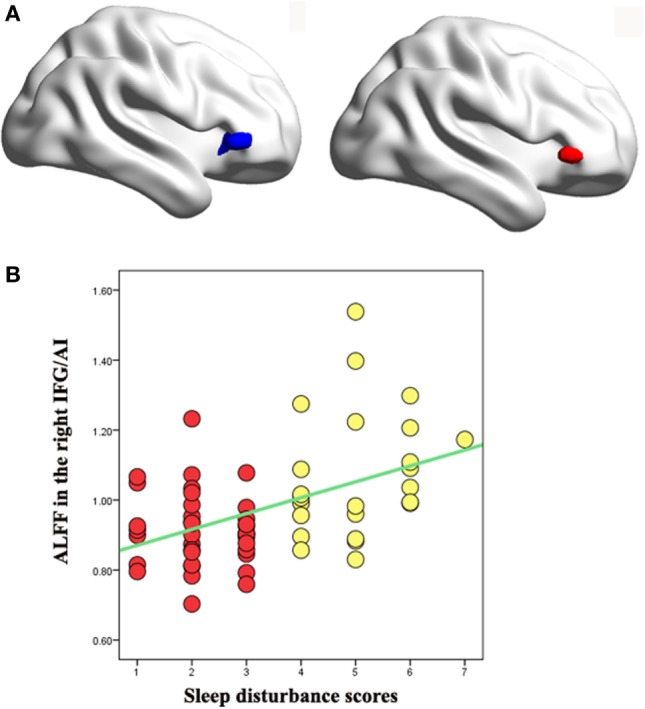
Figure 2.

(A) Left: voxel-wise correlation analysis between the amplitude of low-frequency fluctuation (ALFF) values and sleep disturbance scores revealed positive correlation in the right inferior frontal gyrus/anterior insula (IFG/AI) in pooled major depressive disorder (MDD) patients with high and low insomnia (peak coordinate: 48, 33, 0) with age, gender, educational level, anxiety, and adjusted depression scores as covariates (navy blue). Right: the right IFG/AI region from analysis of variance (ANOVA) of the three groups with the covariates of age, gender, educational level, and adjusted depression scores (red). The two right IFG/AI clusters obviously overlapped. (B) Region of interest (ROI) analysis of the correlation analysis between the right IFG/AI ALFF values and the sleep disturbance scores confirmed that the results from the whole-brain analysis were not driven by outliers. Yellow dots represent MDD patients with high insomnia, and red dots represent MDD patients with low insomnia.
