. 2017 Nov 8;9(3):721–727. doi: 10.1039/c7sc03878j

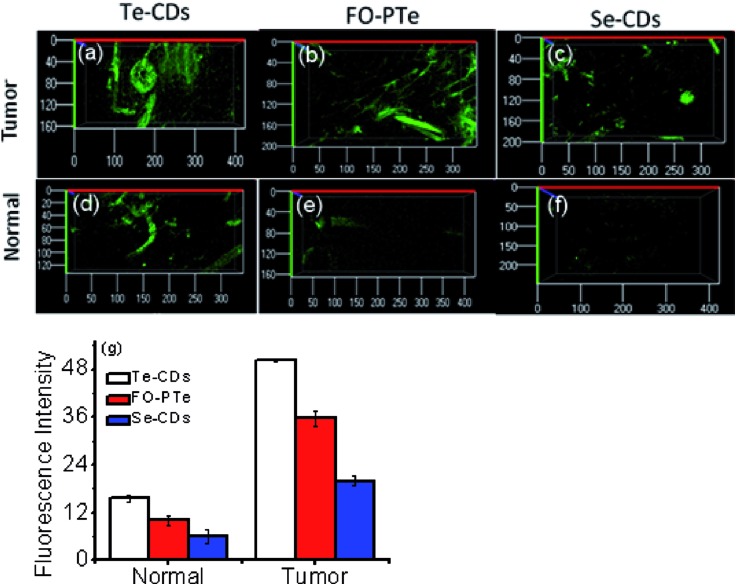
Fig. 6. Fluorescence imaging of O2˙ levels in the tumor tissues of mice with (a) Te-CDs, (b) FO-PTe and (c) Se-CDs and fluorescence imaging of O2˙ levels in the normal tissues of mice with (d) Te-CDs, (e) FO-PTe and (f) Se-CDs. (g) The data output of fluorescence imaging. The error bars were calculated from three parallel experiments. The concentration of the Te-CDs and Se-CDs was 5.0 μg ml–1 and 10.0 μg ml–1, respectively. Images were acquired using 800 nm two-photon excitation, two-photon fluorescence emission windows: 400–500 nm for FO-PTe and Te-CDs and 500–600 nm for Se-CDs. Eighteen mice were used in the experiment and the error bars were from three parallel experiments.

Fig. 6