Fig. 1.

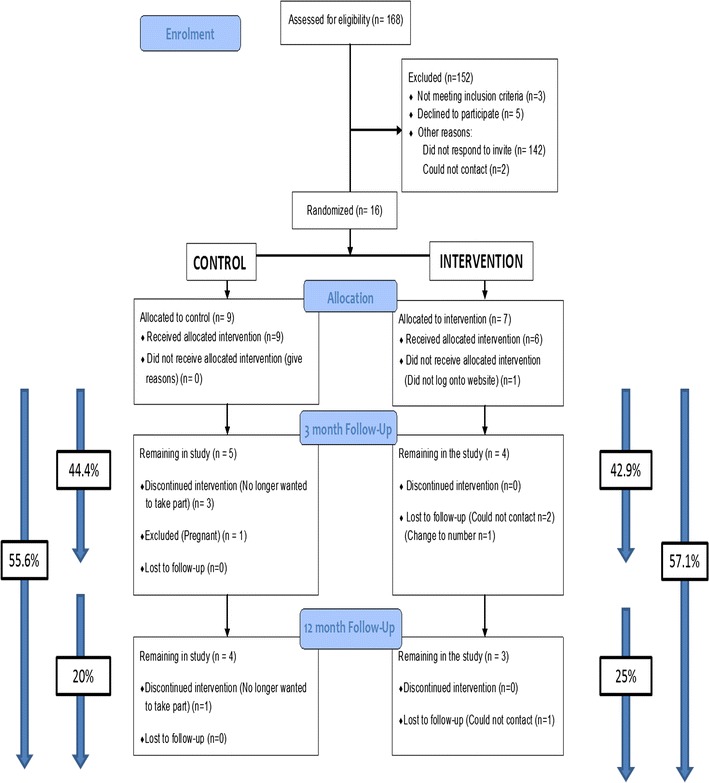
CONSORT pilot RCT participant flow diagram. % included at the sides of the figure show rates of attrition during the study (denominator = number allocated, nominator = number remaining)

CONSORT pilot RCT participant flow diagram. % included at the sides of the figure show rates of attrition during the study (denominator = number allocated, nominator = number remaining)