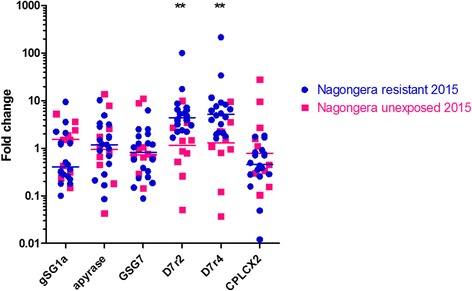
Fig. 3.

Expression of insecticide resistance candidates in An. gambiae s.s. mosquitoes collected in Nagongera in January–May 2015, measured by real-time quantitative PCR. Resistant and unexposed mosquitoes were selected as described in Fig. 2. Each RNA sample was extracted from an individual mosquito. The y-axis depicts the level of transcript in each sample relative to the unexposed control group. The median value for each treatment is indicated by a line. Two-tailed Mann-Whitney p < 0.01 (**)
