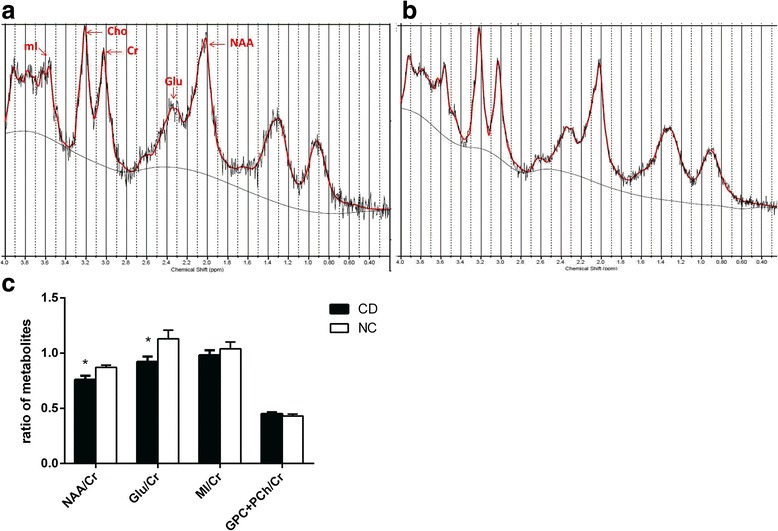
Fig. 3.

Mean (±SD) ratios of rabbit brain metabolites quantified by LCModel. The MRS of rabbit brain in the group RD (a) and group CD (b). The area under the metabolite peaks of the metabolites in the diagram represents the concentration of metabolites measured via LC model. Cr, creatine; Glu, glutamate; MI, myoinositol; NAA, N-acetylaspartate; PCh, phosphorylcholine; GPC, glycerophosphatidylcholine. c Mean (±SD) ratio of rabbit brain metabolites in two groups rabbits * p < 0.05. group NC Japanese white rabbits received routine diet (n = 8); Group CD, rabbits with routine diet plus 2% cholesterol (n = 8)
