
Fig. 6.
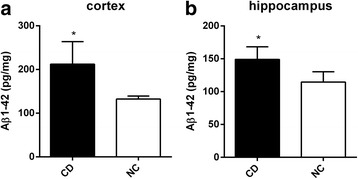
Mean (±SD) Aβ1–42 concentration. The Aβ1–42 concentration of the cortex (a) and hippocampus (b) of the rabbits with routine diet (group NC, n = 8) and rabbits with routine diet plus 2% cholesterol (group CD, n = 8). * p < 0.05
Official websites use .gov
A
.gov website belongs to an official
government organization in the United States.
Secure .gov websites use HTTPS
A lock (
) or https:// means you've safely
connected to the .gov website. Share sensitive
information only on official, secure websites.
Mean (±SD) Aβ1–42 concentration. The Aβ1–42 concentration of the cortex (a) and hippocampus (b) of the rabbits with routine diet (group NC, n = 8) and rabbits with routine diet plus 2% cholesterol (group CD, n = 8). * p < 0.05