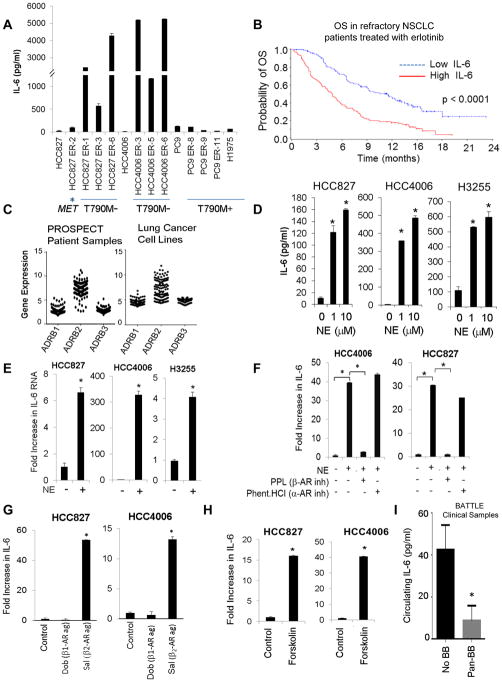
Fig. 1. IL-6 is associated with resistance to EGFR TKIs and is induced by stress hormones.
(A) IL-6 secretion in NSCLC cells with acquired resistance to EGFR TKIs. Data are graphed as mean ± s.d. (B) Median OS in NSCLC patients with high or low circulating concentrations of IL-6 treated with erlotinib. (C) mRNA expression of ADRB1,2,3 in 159 patient samples (left) and in 116 NSCLC cell lines (right). (D) NSCLC cells were stimulated with NE (24 hours). IL-6 secretion was determined by ELISA. *p ≤ 0.001. Bars are mean ± s.e.m. (E) IL-6 mRNA expression after NE stimulation (10 μM for 3 hours). *p ≤ 0.001. Data are graphed as means ± s.d. (F) NE-induced IL-6 secretion after treatment with the β-AR inhibitor propranolol (PPL; 1 μM) or the α-AR inhibitor phentolamine hydrochloride (1 μM). *p≤0.01; one-way ANOVA. Data are graphed as means ± s.d. (G) IL-6 production after treatment with a β1-AR agonist (dobutamine; 50 μM) or a β2-AR agonist (salbutamol; 50 μM) for 24 hours. *p≤0.02; one-way ANOVA. Data are graphed as mean ± s.d. (H) Effect of the adenylyl cyclase activator, forskolin (10 μM), on IL-6 secretion. *p≤0.0002. p-value calculated by two-tailed Student’s t-test. (I) Circulating concentrations of IL-6 in NSCLC patients with or without incidental pan beta blocker use (BB; *p=0.02). Data are graphed as means ± s.e.m.

