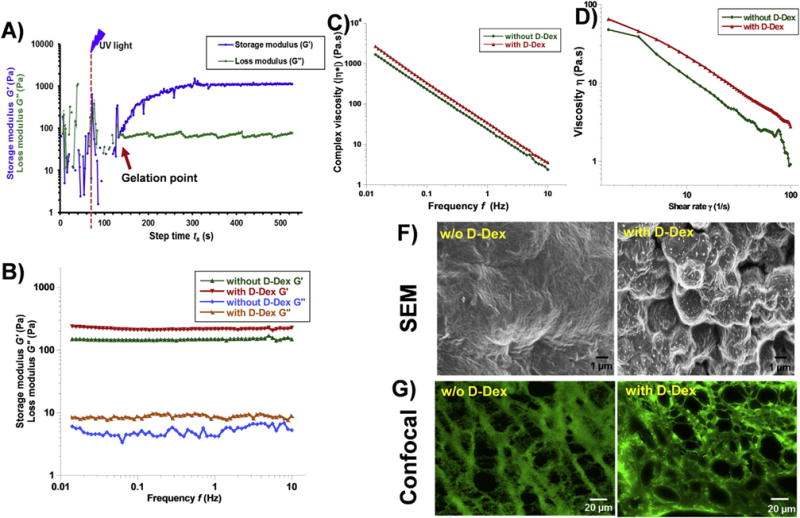
Fig. 3. Characterization of injectable gels using rheology and SEM.

A) Dynamic time sweep photo-rheology of injectable gel formation. The gelation point is approximated when storage modulus (G′) overcomes the loss modulus (G″) (arrow). Dashed line (–) illustrates when the UV light was turned on. B) Frequency sweep measurements of the injectable gel demonstrating their viscoelastic behavior (G′ ⪢ G″). C) viscosity vs frequency plot of injectable gel with and without D-Dex showing similar dynamic viscosity. D) Viscosity vas shear rate plots of injectable gels with and w/o D-Dex showing shear thinning properties. F) SEM images of dehydrated injectable gels with and without D-Dex showing the surface morphology. G) Confocal images of the FITC stained gel sections demonstrating the inner morphology with porous structure.
