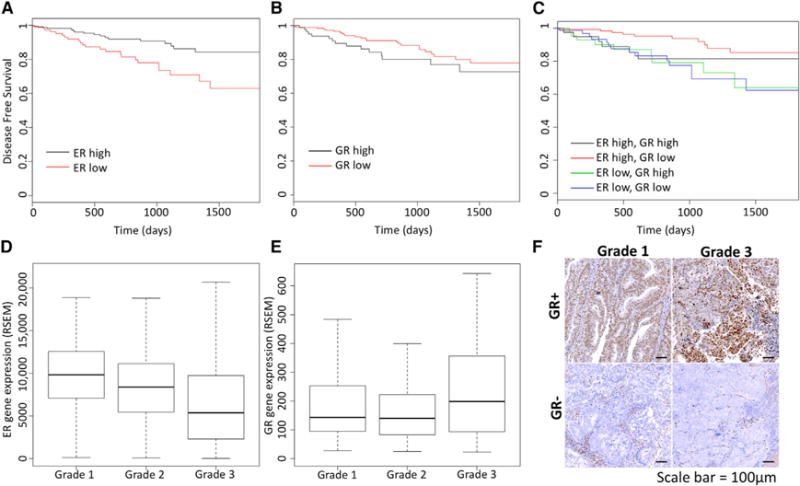
Figure 1. GR Expression Is Associated with Poor Prognosis in Endometrioid Endometrial Cancer.

(A–E) Kaplan-Meier curves show the association of disease-free survival with estrogen receptor α (ER) expression (A, high is top 60% tumors), glucocorticoid receptor (GR) expression (B, high is top 30% tumors), and the combination (C). Higher ER expression is associated with better prognosis, whereas higher GR expression is associated with worse outcomes, but only in the context of high ER expression. ER expression is negatively correlated with tumor grade (D), and GR expression is positively correlated with tumor grade (E).
(F) Examples of GR immunohistochemistry staining are shown for grade 1 and grade 3 tumors.
Scale bar represents 100 μm.
See also Figures S1 and S2.
