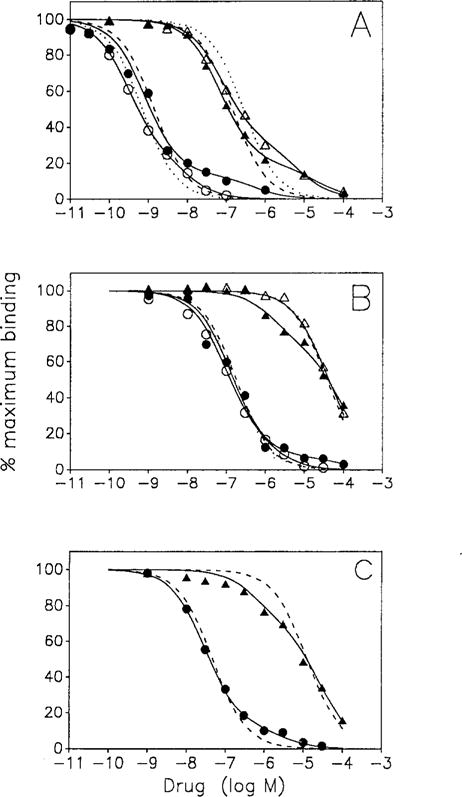
Fig. 1.

A–C. Inhibition curves for antagonist radioligand binding by R-RIA (circles) and NECA (triangles) to sites in cortical (open symbols) and cardiac (closed symbols) membranes. Panel A [3H]XAC, control membranes. Panel B [3H]XAC, NEM-pretreated membranes in presence of 0.1 mM Gpp(NH)p. Panel C [3H]CPX: NEM-pretreated membranes in presence of 0.1 mM Gpp(NH)p. Points shown are averages of duplicate determinations. Nonspecific binding as defined by theophylline (5 mM) is substracted from all data. The two site fits are shown as solid tines. One site fits are shown as – – – (heart) or ⋯ (Brain)
