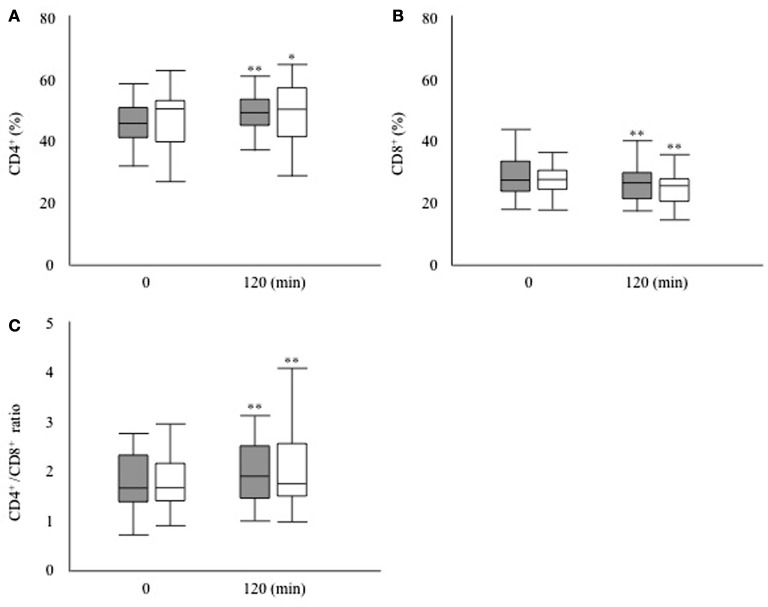
Figure 2.
(A) Proportion of CD4+ T cells, (B) proportion of CD8+ T cells, and (C) CD4+/CD8+ ratio after 120 min of glucose loading during an oral glucose tolerance test in the participants with type 2 diabetes (filled bar) and the participants without diabetes (open bar). *P < 0.05 vs. 0 min, **P < 0.01 vs. 0 min.

